

Graphs
Education and Training
Schools connected to the Internet via Science Technology and Society Network
% of schools by the end of the scholar year indicated, ISDN and broadband connections, 1997/98-2007/08.
Alternative access: 
click the image below to amplify
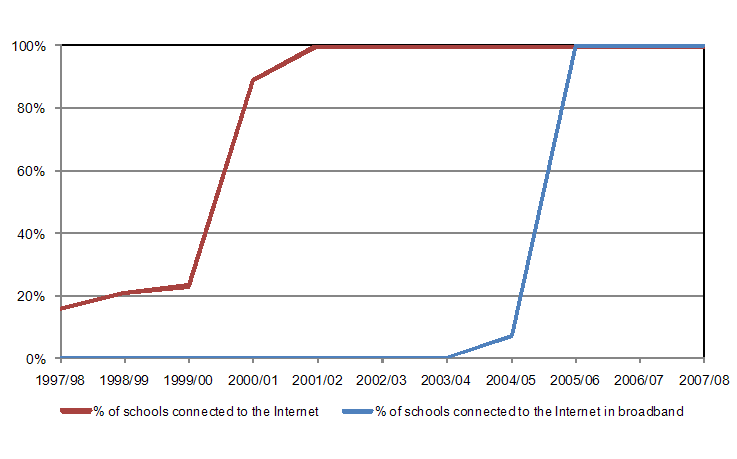
Source: GEPE - Office for Education Statistics and Planning, FCCN - Foundation for National Scientific Computation.
No. of Students per Computer in Elementary and Secondary Education (Total, w/ Internet connection)
No. in the academic year beginning in the indicated year.
Alternative access:
click the image below to amplify
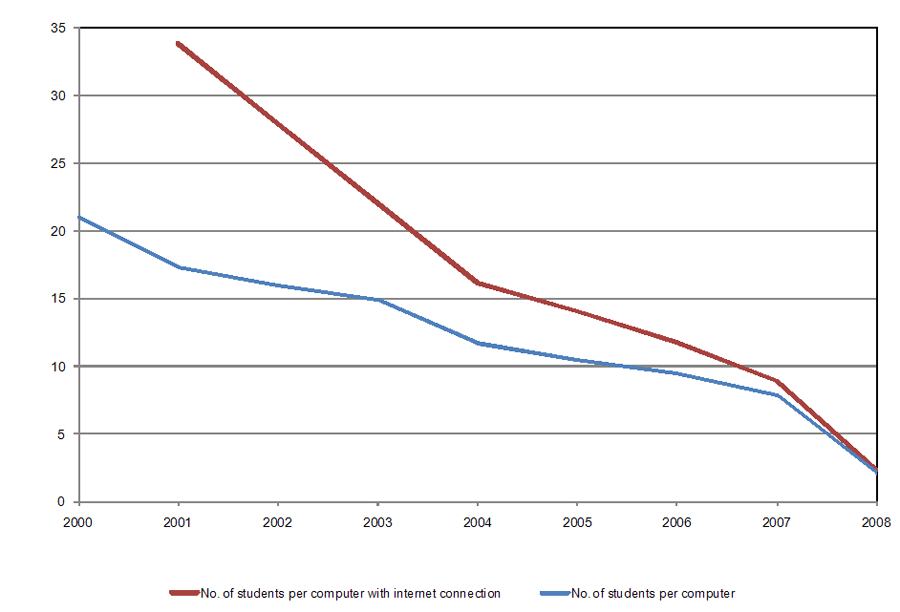
Source: GEPE - Office for Education Statistics and Planning.
See all Education and Training graphs and tables >>
Society and Citizenship
Internet Penetration among the Population (Total, Broadband and Mobile Broadband)
%, Customers from the total population.
Alternative access:
click the image below to amplify

Source: ANACOM.
Broadband Penetration among Population ≥ 10 Mbps in EU Member States
1st January 2010, (%).
Alternative access:
click the image below to amplify

Source: Source: COCOM, DG INFSO, European Commission, May 2010.
Mobile Broadband Penetration among Population in EU member states
Dedicated data service (cards, modems, keys only)
1st January 2010, (%).
Alternative access:
click the image below to amplify

Source: COCOM, DG INFSO, European Commission, May 2010.
Internet Penetration among Households (Total and Broadband)
%, Households of at least one person aged from 16 to 75.
Alternative access:
click the image below to amplify

Source: EUROSTAT.
Computer Penetration among Households (All and Laptops)
%, Households of at least one person aged from 16 to 75 (1st quarter of each year).
Alternative access:
click the image below to amplify
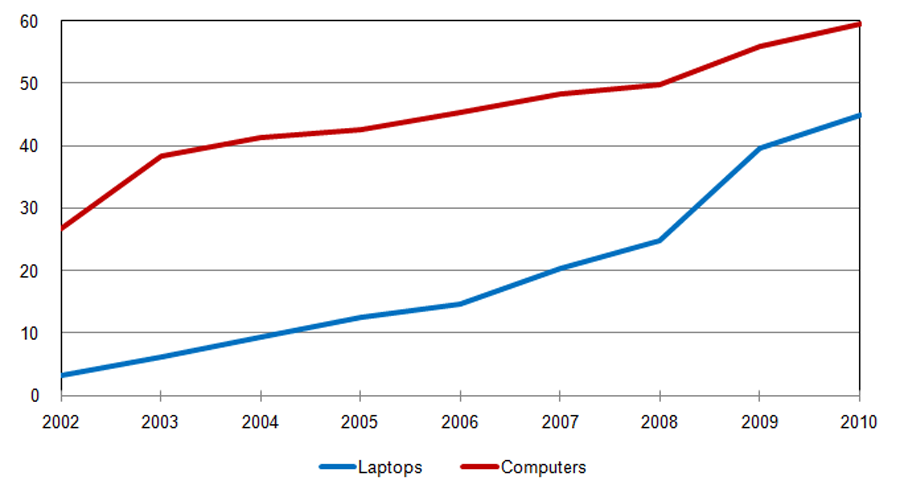
Source: EUROSTAT.
See all Society and Citizenship graphs and tables >>
Inclusion and Accessibility
Internet users by complete education level in the EU Member States
2009, (%) People from 16 to 74 years old.
Alternative access:
click the image below to amplify

Note: Data references 1st quarter of the year.
Source: EUROSTAT.
Internet users by main occupation among EU Member States
2009, (%) People from 16 to 74 years old.
Alternative access:
click the image below to amplify
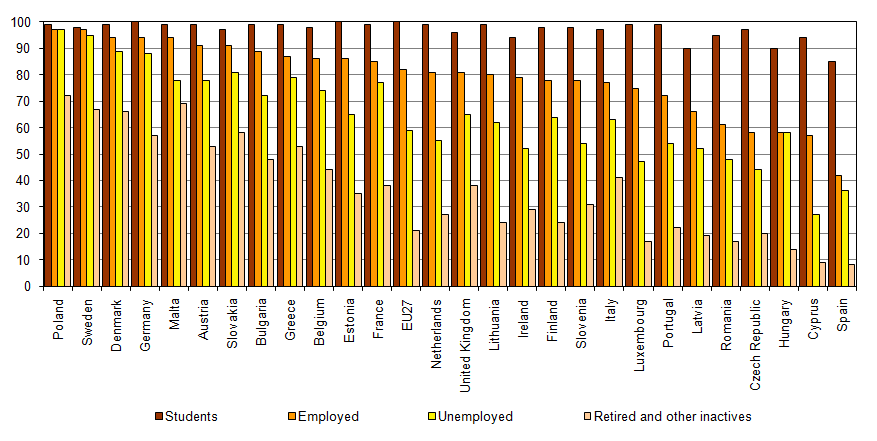
Note: Data references 1st quarter of the year.
Source: EUROSTAT.
Internet users by age groups in EU Member States
2009, (%) people from 16 to 74 years old.
Alternative access:
click the image below to amplify
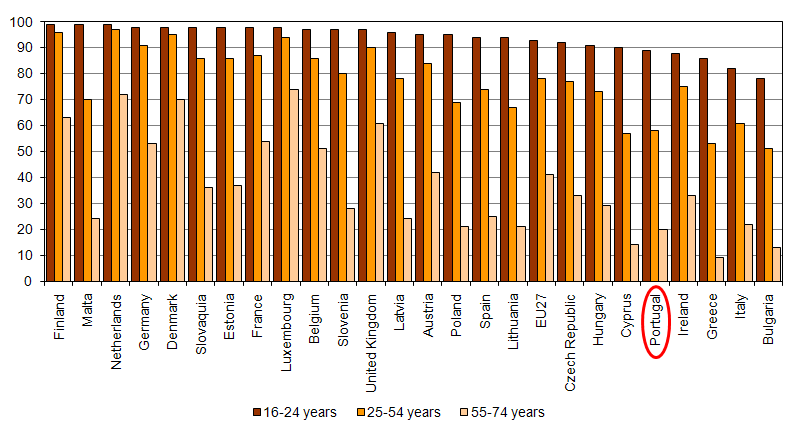
Note: Data references 1st quarter of the year.
Source: EUROSTAT.
Internet users, by age and complete education level
(%) Internet users.
Alternative access:
click the image below to amplify

Note: Data references 1st quarter of the year.
Source: EUROSTAT.
See all Inclusion and Accessibility graphs and tables >>
e-Science
International Connectivity of the RCTS - Science Technology and Society Network (2002-2008)
Giga bits per second (Gps), in July of each year
Alternative access:
click the image below to amplify
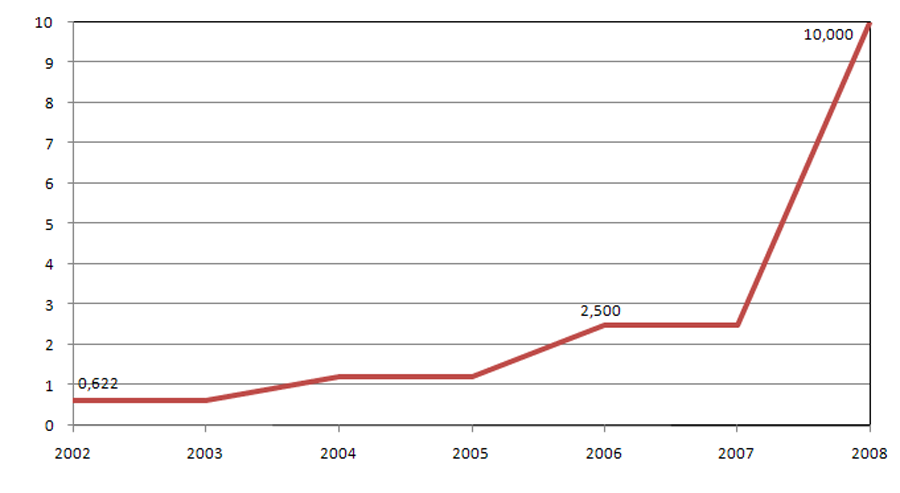
Source: UMIC - Knowledge Society Agency, P.I., based on information from FCCN - Foundation for National Scientific Computation.
GRID Computing Jobs Carried Out for the EGEE Project - Enabling Grids for E-sciencE in Europe at Portuguese places
January 2006 - June 2098, Number of Jobs.
Alternative access:
press the image below to enlarge this
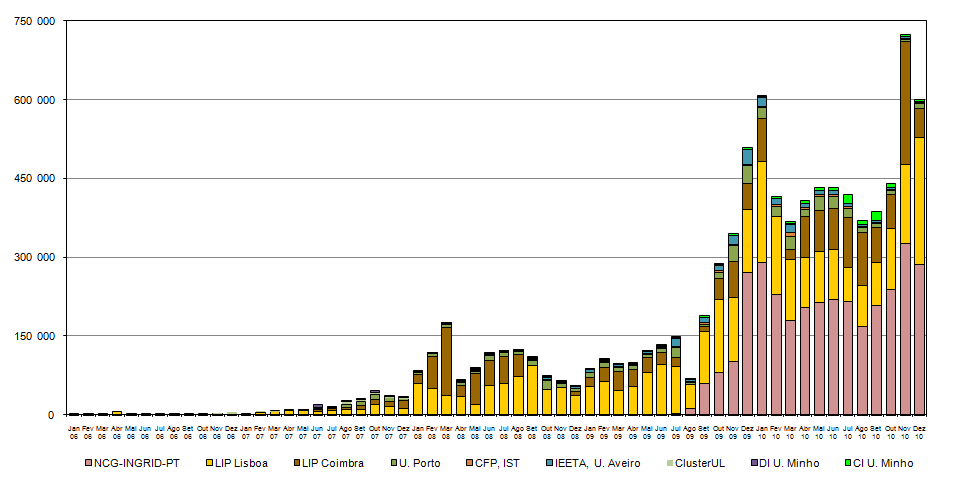
Source: EGEE Accounting Portal.
CPU GRID Computation Time in Portugal for EGEE - Enabling Grids for E-sciencE in Europe project
January 2006 - June 2009, CPU time.
Alternative access:
press the image below to enlarge this
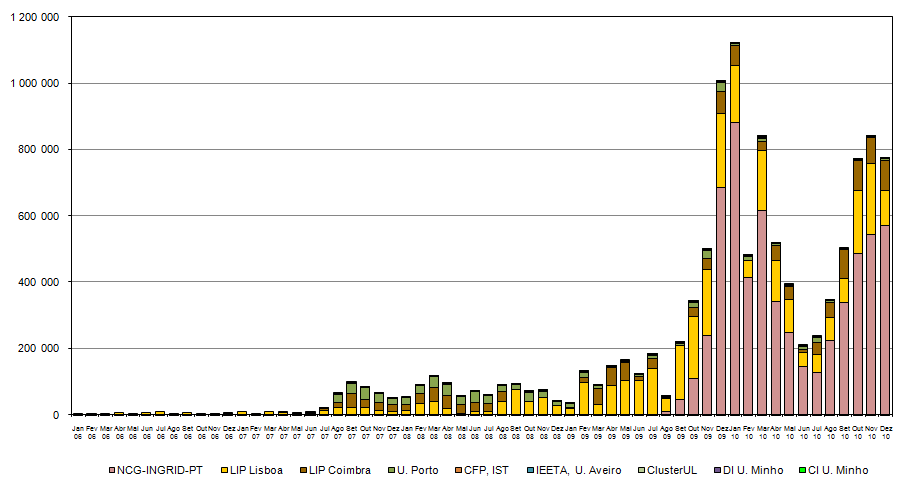
Source: EGEE Accounting Portal.
Registrations in Scientific Open Access Repositories in Portugal
No. of registrations in the end of each year
Alternative access:
click the image below to amplify

Source: UMIC - Knowledge Society Agency, P.I..
Open Access Institutional Repositories in Portugal
No. of institutional repositories by the end of each year
Alternative access:
click the image below to amplify

Source: UMIC - Knowledge Society Agency, P.I..
Distribution of access to the Linguateca website (http://www.linguateca.pt/) by geographical origin
Accumulated hits from July 1998 to November 2008 from top regional domain address 2008
Total number of regional domain hits = 1.592.071, Total number of hits = 8.546.599
Alternative access:
click the image below to amplify
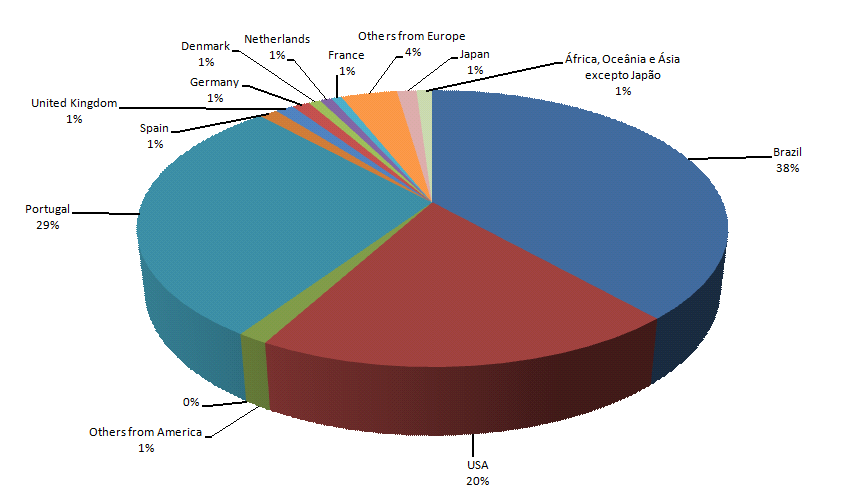
Source: Linguateca.
See all e-Science graphs and tables >>
Knowledge
Budget allocations for the main public institutions providing competitive funding for grants, projects, R&D institutions and infrastructures- JNICT/FCT + IICT/GRICES + UMIC (I&D) + UMIC (I&D)
1986 to 2009, (million Euros, constant 2008 prices).
Alternative access:
click the image below to amplify

N.B.: Budget allocations for the JNICT until 1997, the FCT from 1997 to 2008, plus ICCTI budgetary allocations from 1998 to 2002 and from GRICES from 2003 to 2007 (international S&T cooperation responsibilities moved from the JNICT to ICCTI in 1997, then to GRICES in 2003 and to the FCT in 2007), and also the POSI/POSC and UMIC R&D budget allocations.
Source: OCT/OCES/GPEARI MCTES - Statistics.
Total R&D Public Budget
1986 to 2009, (million Euros, constant 2008 prices).
Alternative access:
click the image below to amplify

Source: OCT/OCES/GPEARI MCTES - Statistics.
Share of R&D Public Budget in Total Public Budget
(National and EU Funding)
1986 to 2009, (%).
Alternative access:
click the image below to amplify

Source: OCT/OCES/GPEARI MCTES - Statistics, DGO.
Share of Total R&D Spending in GDP
1964 to 2008, (%).
Alternative access:
click the image below to amplify

Source: OCDE.
Share of Total R&D Spending in Enterprise in GDP
1964 to 2008, (%).
Alternative access:
click the image below to amplify

Source: OCDE.
Share of R&D spending by implementing sector in 2008
2008, (%).
Alternative access:
click the image below to amplify

Source: OCT/OCES.
Share of R&D spending by implementing sector in 1995
1995, (%).
Alternative access:
click the image below to amplify

Source: OCT/OCES.
Doctorates carried out or recognised by Portuguese Universities
1970 to 2008, Number of Doctorates
Alternative access:
press the image below to amplify

Source: OCT/OCES/GPEARI Statistics, FCT.
Doctorate and Post-Doctorate Grants conceded annually by the FCT
1990 to 2008, Number of grants conceded
Alternative access:
press the image below to amplify

Source: OCT/OCES/GPEARI Statistics, FCT.
Number of researchers in full-time equivalent (FTE)
1976 to 2008, Number of researchers (FTE)
Alternative Access:
click the image below to amplify

Source: OCDE.
Accumulated values of doctorates carried out in Portugal and abroad and recognised by Portuguese Universities since 1970
1975 to 2008, Total number of Doctorate holders (Annex table: since 1970)
Alternative access:
press the image below to amplify

Source: OCT/OCES/GPEARI Statistics, Ministry of Science, Technology and Higher Education.
Number of scientific publications by year of authorship or co-authorship of portuguese researchers(Included in Science Citation Index Expanded - Thomson/ISI)
1990 to 2008, Number of publications
Alternative access:
click the image below to amplify

Notes:
1) Data obtained from the "National Citation Report for Portugal 1981-2008";
2) The values for 2008 are considered provisional.
Source: GPEARI - Planning, Strategy, Evaluation and International Relations Office / Ministry of Science, Technology and Higher Education.
R&D Public Budget share in GDP
2008, (%)
Alternative access:
click the image below to amplify

Note: Latest available values: Belgium, Spain, Greece, Luxembourg, Poland and Romania - 2007; United Kingdom and EU27 - 2006; Hungary - 2005.
Source: OECD, Dec. 2009.
Share of total R&D spending in GDP
2008, (%)
Alternative access:
press the image below to amplify

N.B.: Data for Greece, 2008, are 2007.
Source: EUROSTAT, Jan. 2009.
Average annual growth of the share of total R&D spending in GDP from 2005 to 2008
(%)
Alternative access:
press the image below to amplify

N.B.: Data for Greece, 2008, are 2007.
Source: EUROSTAT, Jan. 2009.
Trend of the R&D total spending share in GDP. EU countries with values from 0,5% to 2%
%
Alternative access:
press the image below to amplify

Source: EUROSTAT, Jan. 2009.
Portugal Position in the Ranking of the Share of R&D Spending in GDP among the EU27 countries over time
place in the ranking for the 27 countries
Alternative access:
press the image below to amplify

Source: EUROSTAT, Jan. 2009.
Researchers (FTE) per 1,000 active population
1995-2007, ()
Alternative access:
click the image below to amplify

Source: OECD, Dec. 2008.
Average annual growth of the number of researchers (FTE) per 1,000 active population, from 2004 to 2007
(%)
Alternative access:
click the image below to amplify

Source: OECD, Dec. 2008.
Share of PhD's obtained in EU countries for the corresponding age step
(%)
Alternative access:
click the image below to amplify

Source: OECD, Education at a Glance 2009.
PhD Students in S&T* areas among the population with 20-29 years old
(%)
Alternative access:
click the image below to amplify

Note: No avalilable data for Germany, Netherlands and Luxembourg
* Sciences, Math, Computation, Engineering
Source: EUROSTAT, Jan. 2009.
See all Knowledge graphs and tables >>
Enterprise
eBusiness Indicators from the European Commission Report on the i2010 initiative for the Information Society for 2008 (indicators 1 to 4)
2008, 1st Quarter, (%)
Alternative access:
click the image below to amplify

eBusiness Indicators from the European Commission Report on the i2010 initiative for the Information Society for 2008 (indicator 5 to 7)
2008, 1st Quarter, (%)
Alternative access:
click the image below to amplify

eCommerce Indicators from the European Commission Report on the i2010 initiative for the Information Society for 2008
2008, 1st Quarter, (%)
Alternative access:
click the image below to amplify

Enterprises having received orders online
% enterprises
Alternative access:
click the image below to amplify

See all Enterprise graphs and tables >>
Public Services
Progress of Portugal position in the Rankings of online Public Services availability among EU15 countries
2001 to 2009, Ranking.
Alternative access:
click the image below to amplify
Source: Capgemini Reports prepared for the Information Society and Media Directorate-General, European Commission.
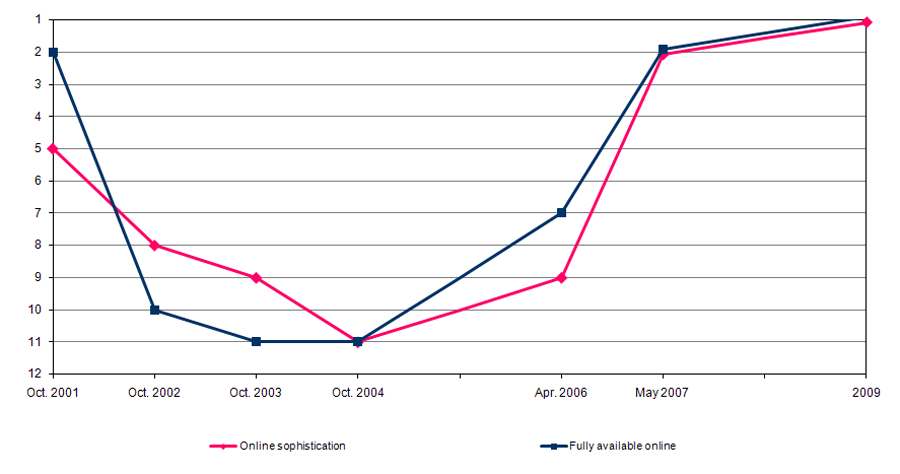
Progress of full availability of basic Public Services online indicator
2001 to 2009 (Score %)
Alternative access:
click the image below to amplify
Source: Capgemini Report prepared for the Information Society and Media Directorate-General, European Commission.
Sophistication Ranking of basic public services online
2009 (Score %).
Alternative access:
click the image below to amplify
N.B.: UE27+ = UE27 + Croatia, Iceland, Norway e Switzerland.
Source: Capgemini Report prepared for the Information Society and Media Directorate-General, European Commission, November 2009.
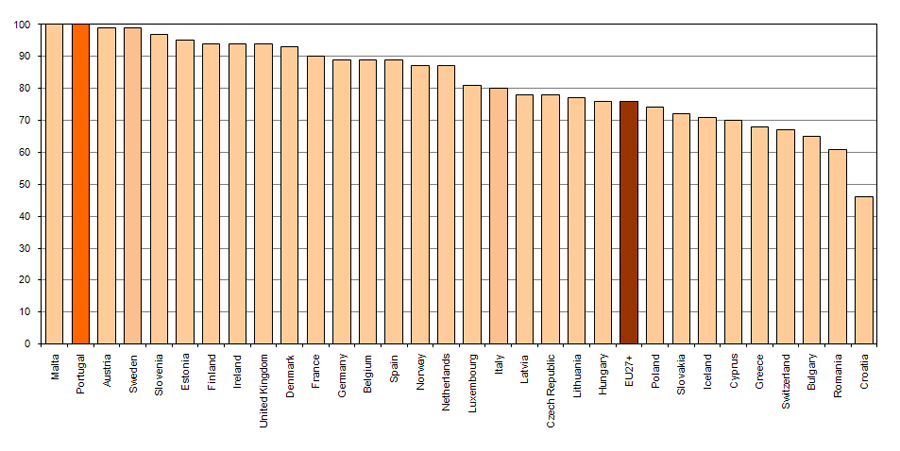
Full availability ranking of basic public services online
2009 (Score %).
Alternative access:
click the image below to amplify
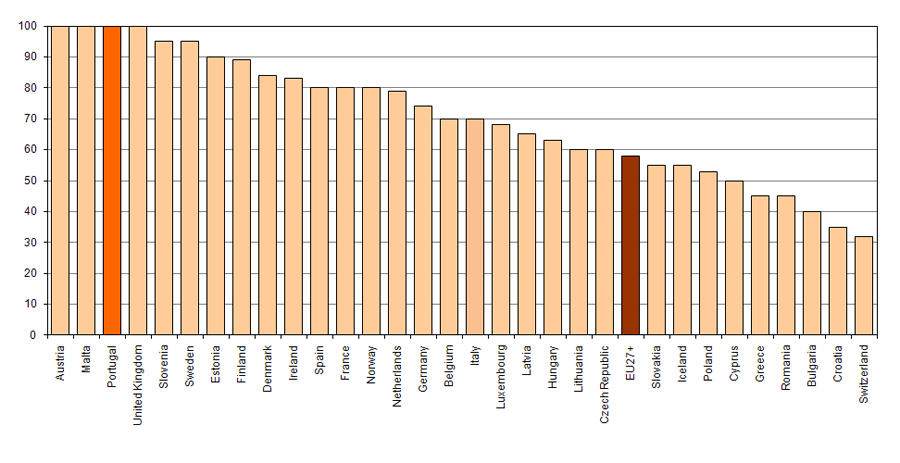
N.B.: UE27+ = UE27 + Croatia, Iceland, Norway e Switzerland.
Source: Capgemini Report prepared for the Information Society and Media Directorate-General, European Commission, November 2009.
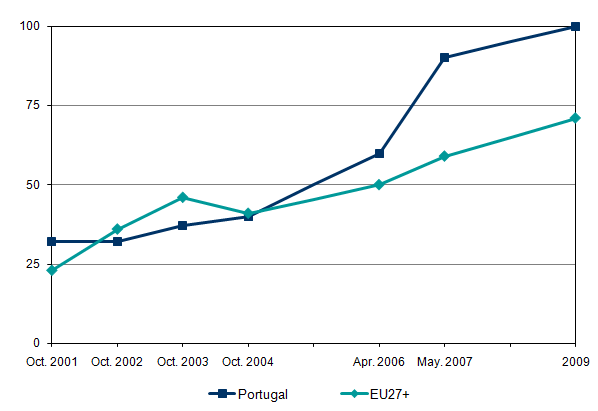
Basic Public Services (Full Online Availability, Sophistication)
%, end of each year
Alternative access:
press the image below to amplify
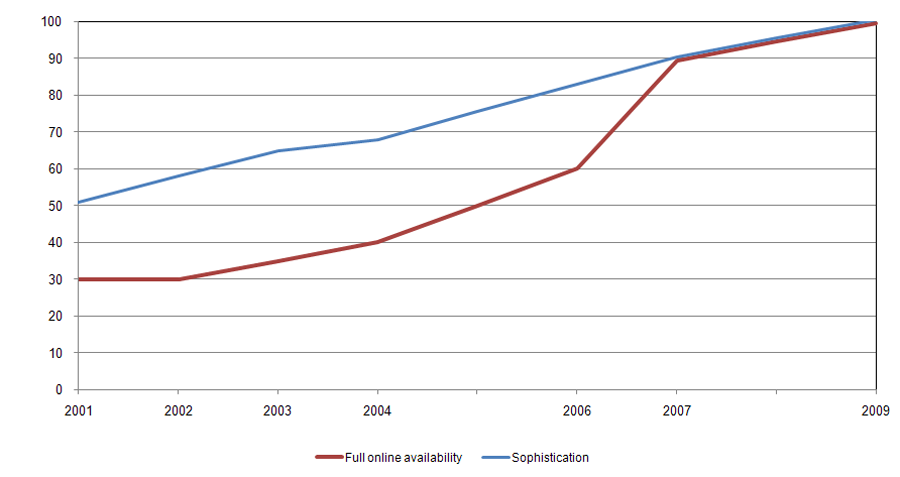
Source: Capgemini report prepared for the Directorate-General for the Information Society and Media of the European Commission.
Number of Personal Income Tax (IRS) returns filled online (millions)
2003 to 2010, (million returns).
Alternative access:
press the image below to amplify
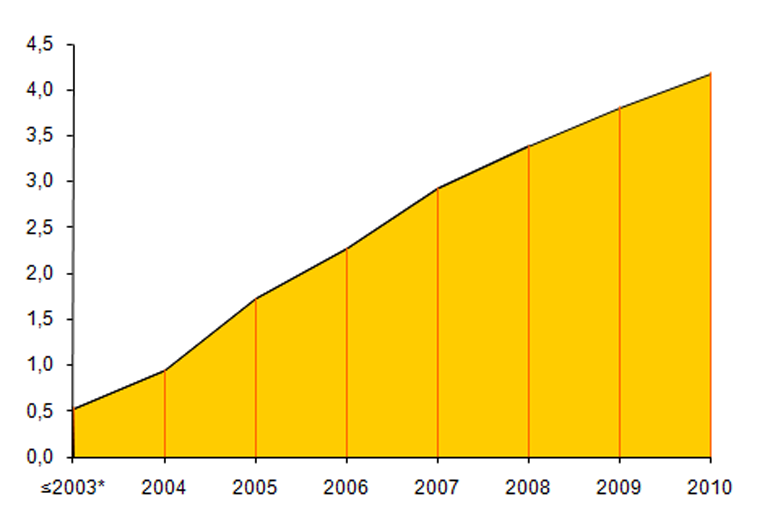
*Accumulated value.
Source: Directorate-General for Tax.
Number of Value-added Tax (IVA) returns filled online
≤2003* to 2009, (million returns)
Alternative access:
click the image below to amplify
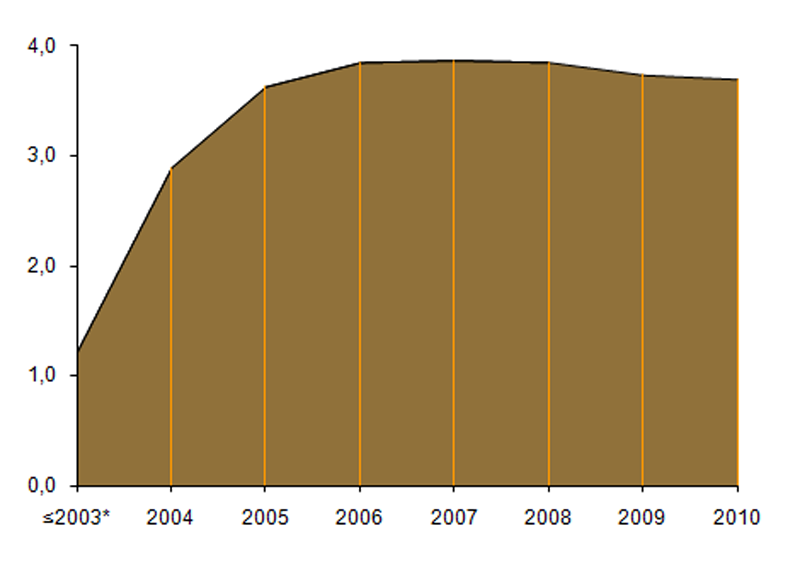
*Accumulated value.
Fonte: Directorate-General for Tax.
Total value negotiated with the National Programme for eProcurement
2003 a 2006, (millions of Euros).
Alternative access:
Click on the image below to enlarge this
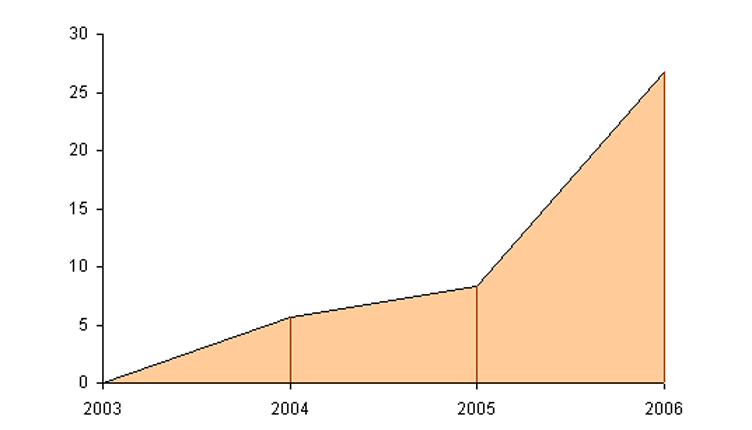
Source: UMIC - Knowledge Society Agency, P.I., July 2006.