

Graphs and Tables - Knowledge
Evolution of the percentage of R&D expense in GDP for EU Member States with values between 0.5% and 2%
%
Alternative access: 
click the image below to amplify

Source: EUROSTAT, Dec. 2010.
Evolution of the rank of Portugal in percentage of R&D expense in GDP within EU27
Rank within EU Member States
Alternative access:
click the image below to amplify
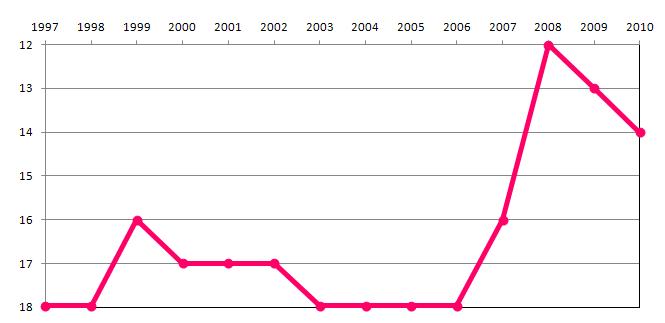
Source: EUROSTAT, Dec. 2010.
Budget allocations for the main public institutions providing competitive funding for grants, projects, R&D institutions and infrastructures - JNICT/FCT + IICT/GRICES + UMIC (I&D) + UMIC (I&D)
(National and Community funds)
Million Euros, constant prices 2010
Alternative access:
click the image below to amplify
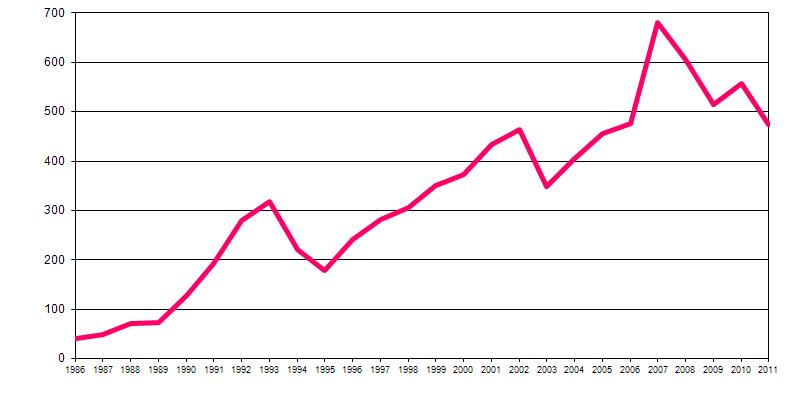
N.B.: Budget allocations for the JNICT until 1997, the FCT from 1997 to 2008, plus ICCTI budgetary allocations from 1998 to 2002 and from GRICES from 2003 to 2007 (international S&T cooperation responsibilities moved from the JNICT to ICCTI in 1997, then to GRICES in 2003 and to the FCT in 2007), and also the POSI/POSC and UMIC R&D budget allocations.
Source: OCT/OCES/GPEARI MCTES - Statistics
Total R&D Public Budget
(National and Community funds)
Million Euros, constant prices of 2010
Alternative access:
click the image below to amplify
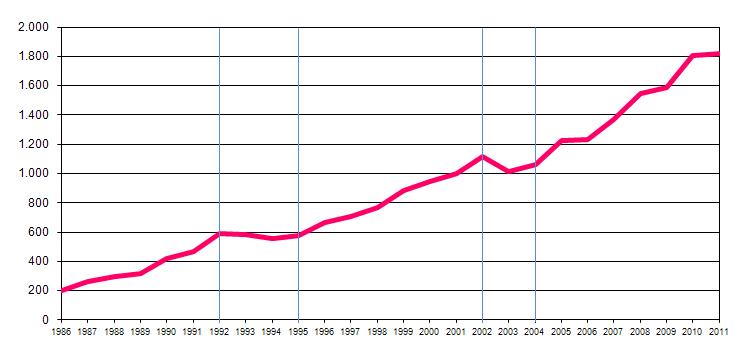
Source: OCT/OCES/GPEARI MCTES - Statistics.
Percentage of Public R&D Budget in Total Public Budget
(National and Community Funds),
%
Alternative access:
click the image below to amplify
Source: OCT/OCES/GPEARI MCTES - Statistics, DGO.
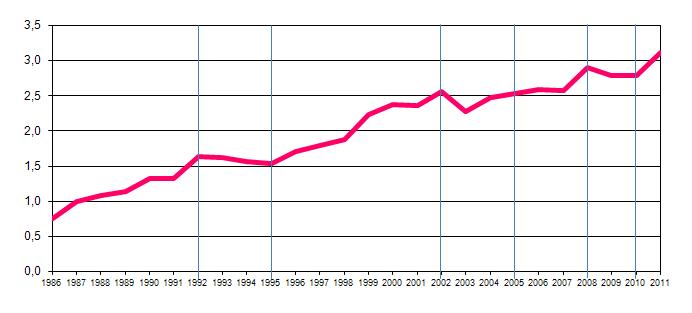
Percentage of Total R&D Spending in GDP of Portugal
%
Alternative access:
click the image below to amplify
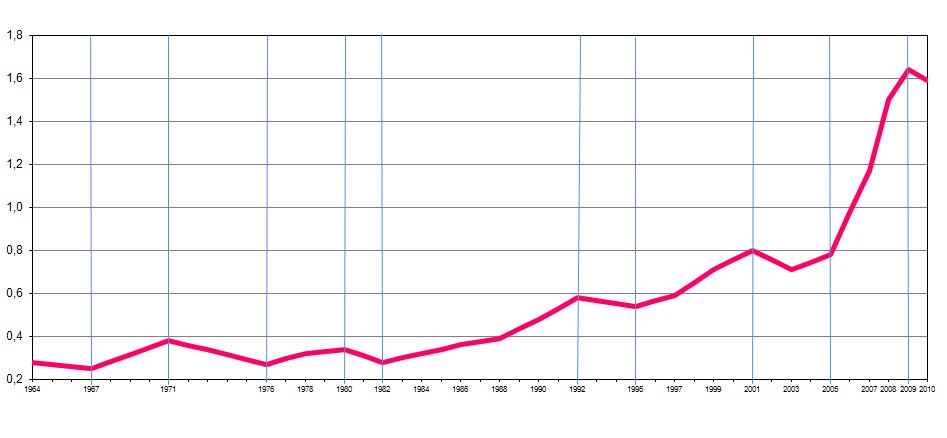
Source: OCDE.
Percentage of R&D Spending in Enterprises in the GDP, in Portugal
%
Alternative access:
click the image below to amplify
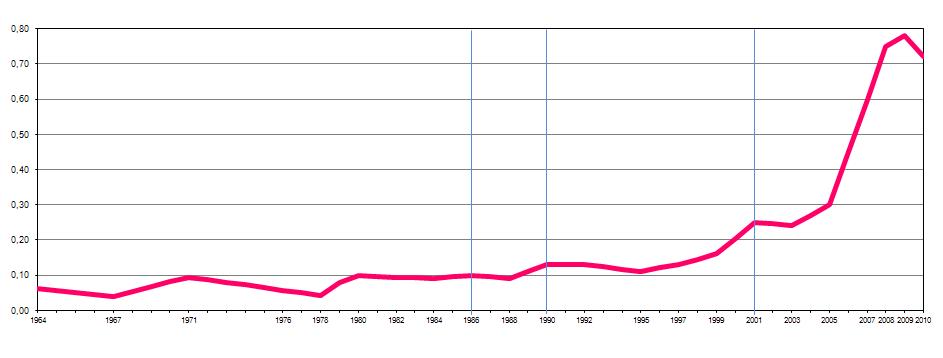
Source: OCDE.
Number of Researchers (FTE) in Portugal
Number of researchers (FTE)
Alternative Access:
click the image below to amplify
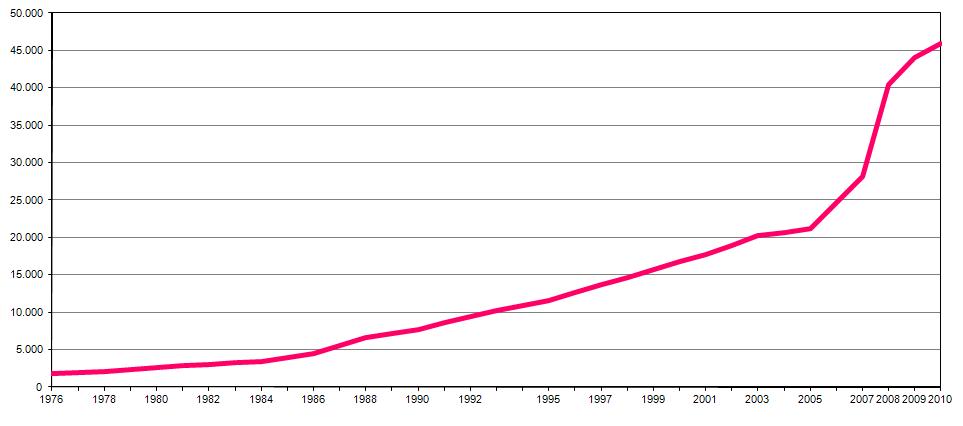
Note: Values where linearly interpolated for graphical purposes when needed.
In 2008 the survey method was changed in order to include also higher education researchers who were not integrated in R&D units evaluated and funded by the FCT.
Source: OCDE.
Number of scientific publications by year of authorship or co-authorship of portuguese researchers(Included in Science Citation Index Expanded - Thomson/ISI)
Number of publications
Alternative access:
click the image below to amplify
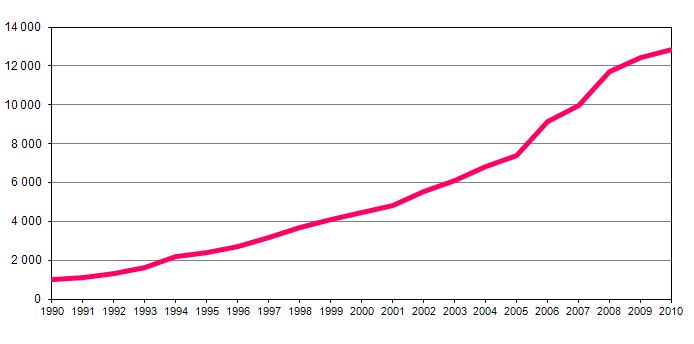
Notes:
1) Data obtained from the "National Citation Report for Portugal 1981-2009";
2) The values for 2009 are considered provisional.
Source: GPEARI - Planning, Strategy, Evaluation and International Relations Office / Ministry of Science, Technology and Higher Education.
Share of R&D spending by sector in 2009
2009, (%).
Alternative access:
click the image below to amplify
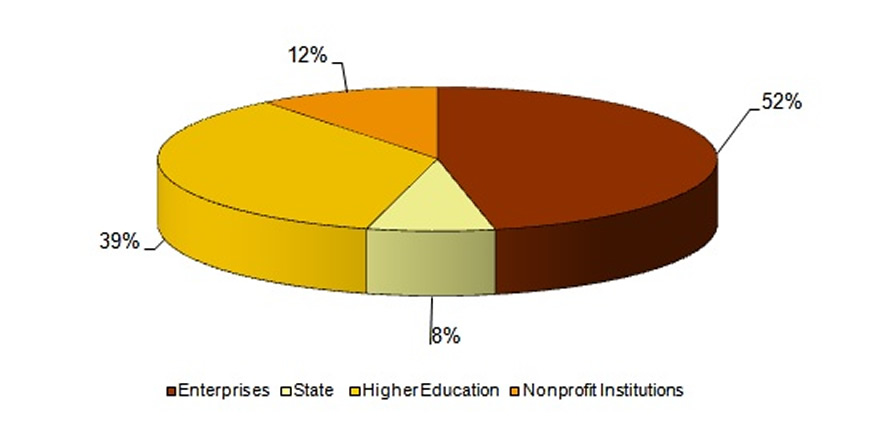
Fonte: OCT/OCES/GPEARI - Statistics.
Share of R&D spending by implementing sector in 1995
1995, (%).
Alternative access:
click the image below to amplify

Source: OCT/OCES/GPEARI MCTES - Statistics.
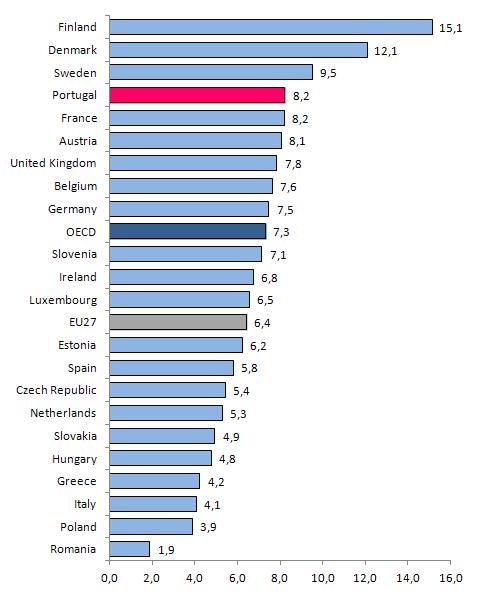
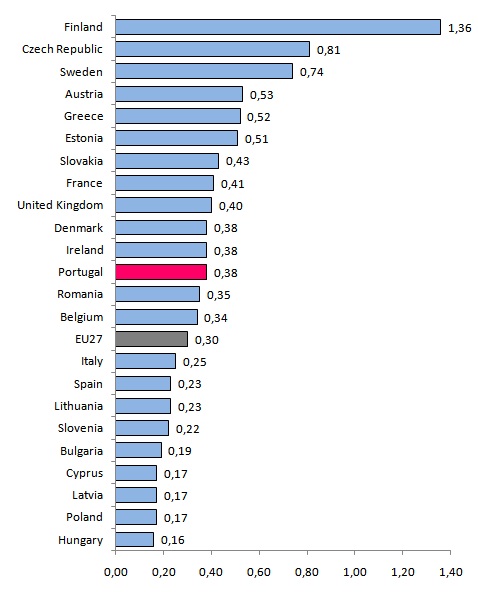
Percentage of total R&D spending in GDP
2009, (%)
Alternative access:
click the image below to amplify
N.B.: Data used for Greece in 2009 are those of 2007, the most recent available.
Source: EUROSTAT, Dec. 2010.
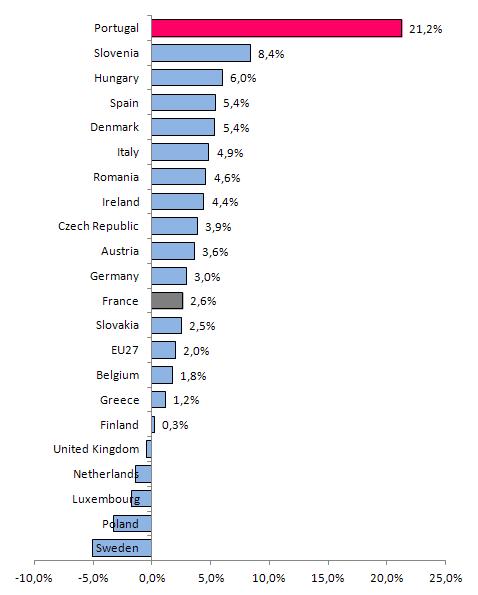
Average annual growth of the percentage of total R&D spending in GDP of Portugal from 2005 to 2009
(%)
Alternative access:
click the image below to amplify
Note: Data used for Greece for 2009 are from 2008, the most recent available.
Source: EUROSTAT, Dec, 2010.
R&D Public Budget as a percentage of GNP in EU Member States
(%)
Alternative access:
click the image below to amplify
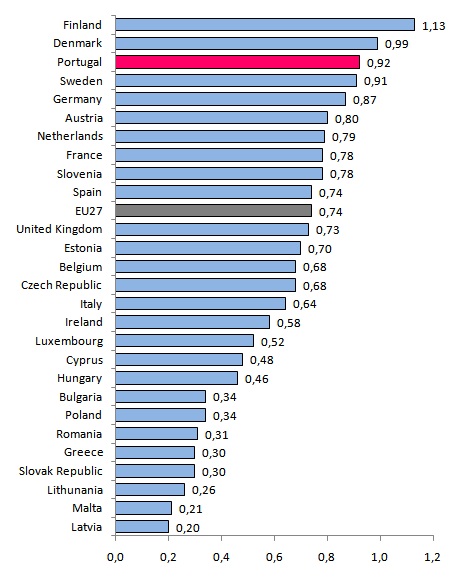
Note: Data of Greece for 2009 is from 2007, the last available data.
Source: EUROSTAT, Dec. 2010.
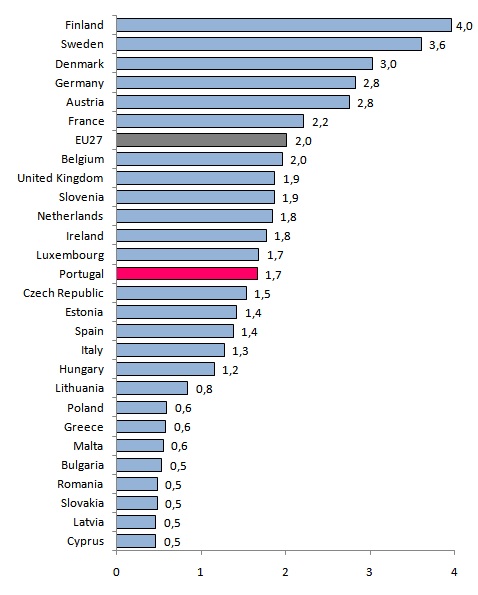
Researchers (FTE) per 1,000 active population
2008, ()
Alternative access:
click the image below to amplify
Note: Data for 2008 for Slovenia and United Kingdom are from 2007, the last available data in these cases.
Source: OECD, Dec. 2009.
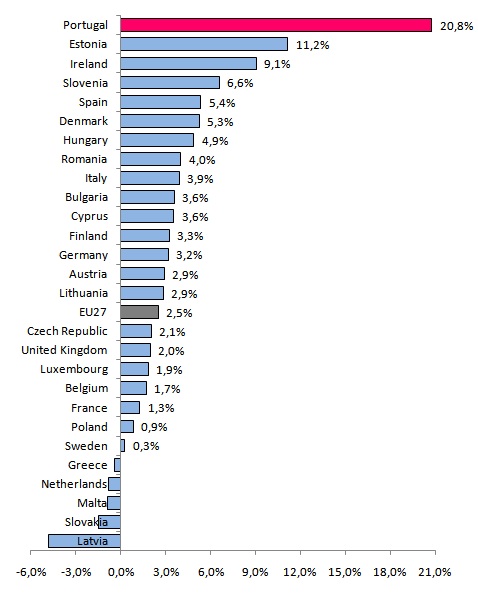
Average annual growth of the number of researchers (FTE) per 1,000 active population in EU Member States, from 2004 to 2008
(%)
Alternative access:
click the image below to amplify
Source: OECD, Dec. 2009.
Accumulated number of PhDs in Portugal and abroad but recognised by Portuguese Universities since 1970
Total number of PhDs awarded
Alternative access:
click the image below to amplify
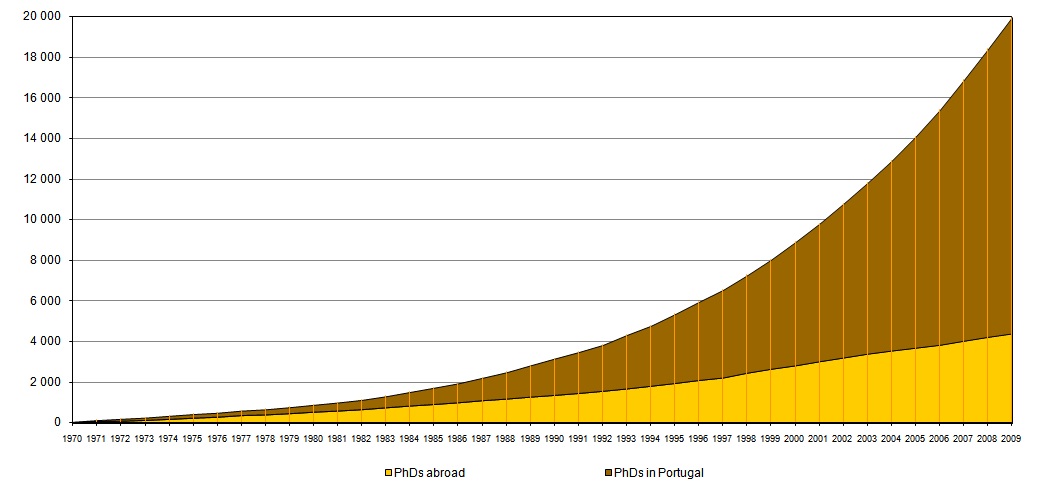
Source: OCT/OCES/GPEARI Statistics, Ministry of Science, Technology and Higher Education.
PhDs from or recognised by Portuguese Universities
Number of Doctorates
Alternative access:
click the image below to amplify

Source: OCT/OCES/GPEARI Statistics, Ministry of Science, Technology and Higher Education.
PhD and Post-Doc fellowships awarded annually by FCT
Number of fellowships awarded
Alternative access:
click the image below to amplify
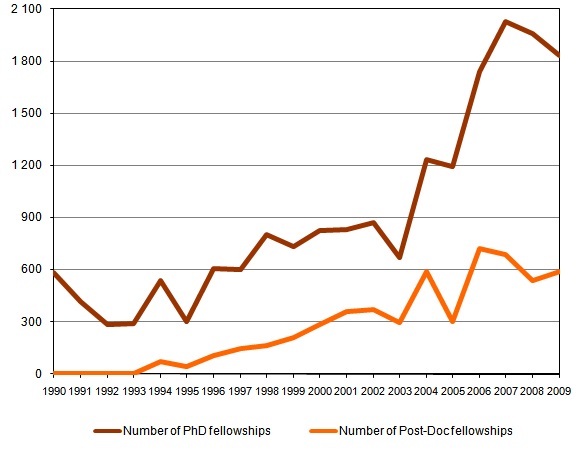
Source: OCT/OCES/GPEARI Statistics, FCT.
PhD Students in S&T* in the 20-29 years old population cohort, in EU Member States
2008, (%)
Alternative access:
click the image below to amplify
Note: No data available for Germany, Netherlands and Luxembourg
Data for Italy and EU27 in 2008 are from 2007, the last available data.
* Sciences, Mathematics, Computer Science, Engineering
Source: EUROSTAT, Jan. 2009.
Percentage of PhD's obtained in EU countries in the corresponding age bracket
2008, (%)
Alternative access:
click the image below to amplify

Note: The value for Itlay in 2008 is that of 2007, the last one available.
Source: OECD, Education at a Glance 2010.
Percentage of PhD's obtained by women in EU countries
2007, (%)
Alternative access:
click the image below to amplify

Source: OECD, Education at a Glance 2009.
Percentage of PhD's obtained in EU countries in the corresponding age brackets
2008, (%)
Alternative access:
click the image below to amplify

Note: The value for Itlay in 2008 is that of 2007, the last one available.
Source: OECD, Education at a Glance 2010.
Percentage of Population with PhD in Some OECD Member States and Partner Economies
2008, (%) Population 26-64 years old
Alternative access:
click the image below to amplify
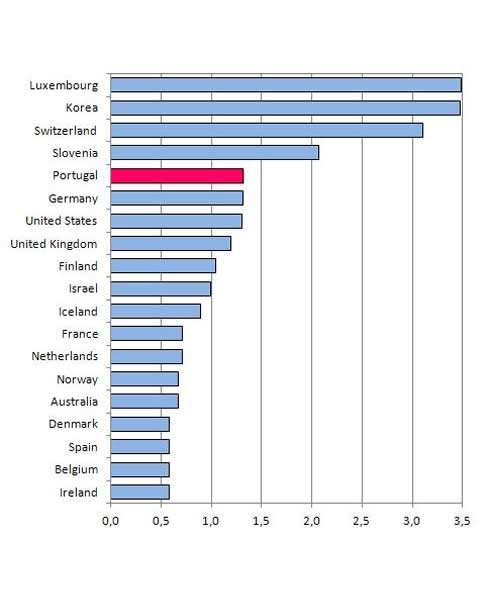
Source: Education at a Glance 2010, OECD.
Women Researchers in the Total of Researchers in EU Member States
2007, (%)
Alternative access:
click the image below to amplify
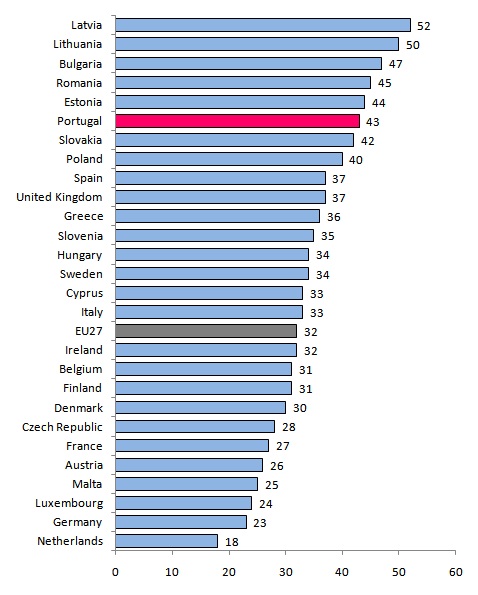
Note: Data used for 2007 for France and Italy are from 2006, and for Greece and the Netherlands are from 2005, the last available data in these cases.
Source: EUROSTAT, Dec. 2010.
Contribution of the investment in ICT for GDP growth in EU countries and the USA
1990-1995, 1995-20011, (percentage points)
Alternative access:
click the image below to amplify
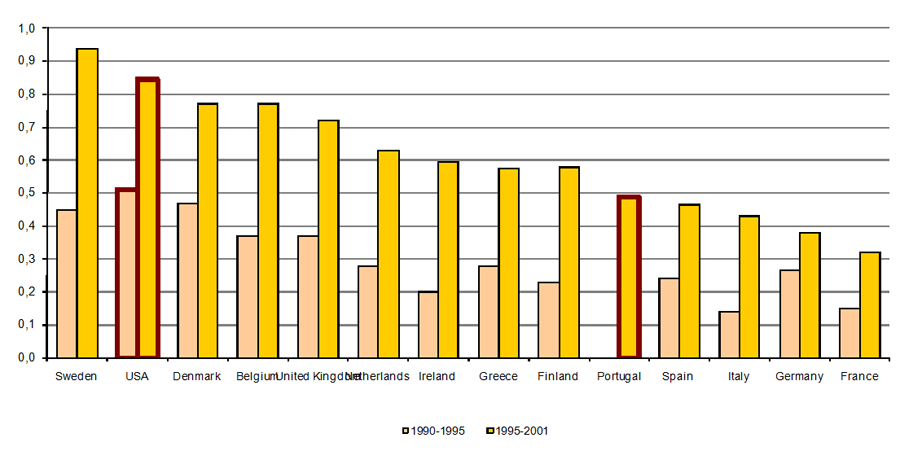
Note: 1995-2002 for Germany, France and the USA.
Data/Source: OECD.
Expansion of software enterprises with R&D activities
1995-2001, Number of companies
Alternative access:
click the image below to amplify
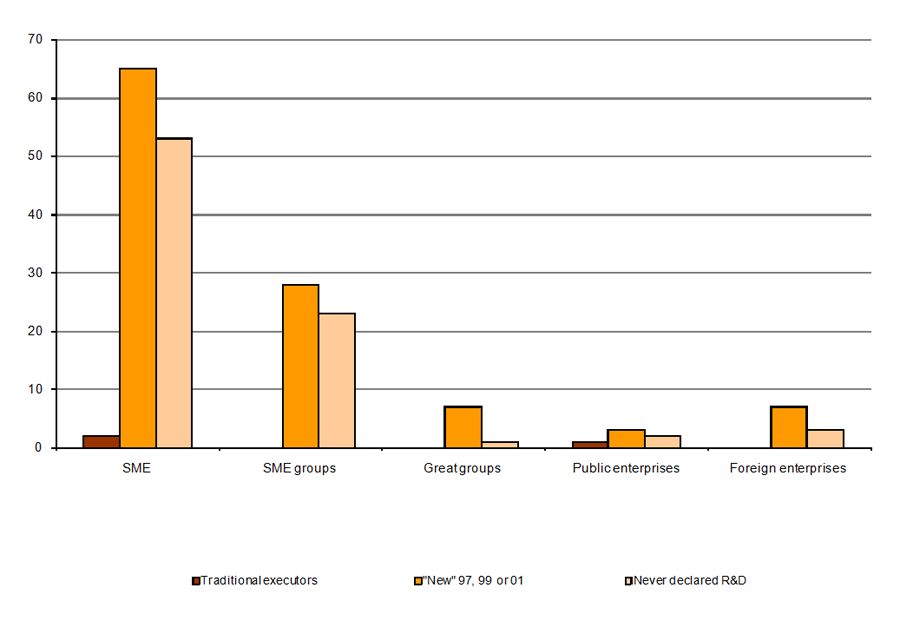
Source: The enlargement of the universe of enterprises with participation in R&D activities (1995-2001),
Part I - Evolution of enterprises R&D activities between 1995 and 2001, Maria Paula Fonseca, OCES, Aug. 2004.