

Graphs
- 26/11/2008Education and Training
Schools connected to the Internet via Science Technology and Society Network
% of schools by the end of the scholar year indicated, ISDN and broadband connections, 1997/98-2007/08.
Alternative access: 
click the image below to amplify
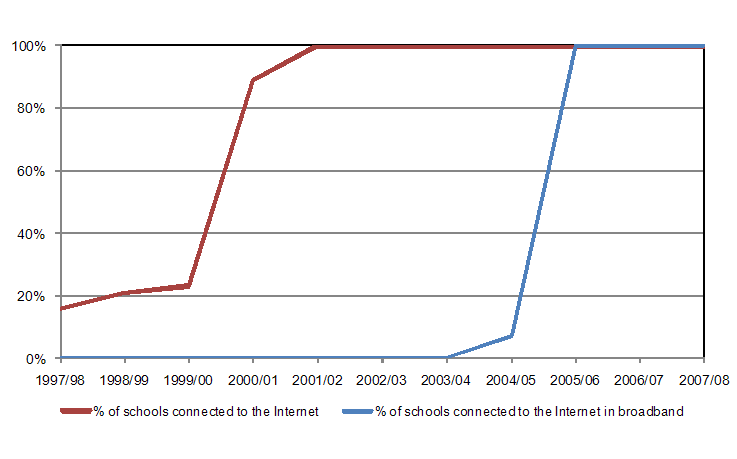
Source: GEPE - Office for Education Statistics and Planning, FCCN - Foundation for National Scientific Computation.
No. of Students per Computer in Elementary and Secondary Education (Total, w/ Internet connection)
No. in the academic year beginning in the indicated year.
Alternative access:
click the image below to amplify
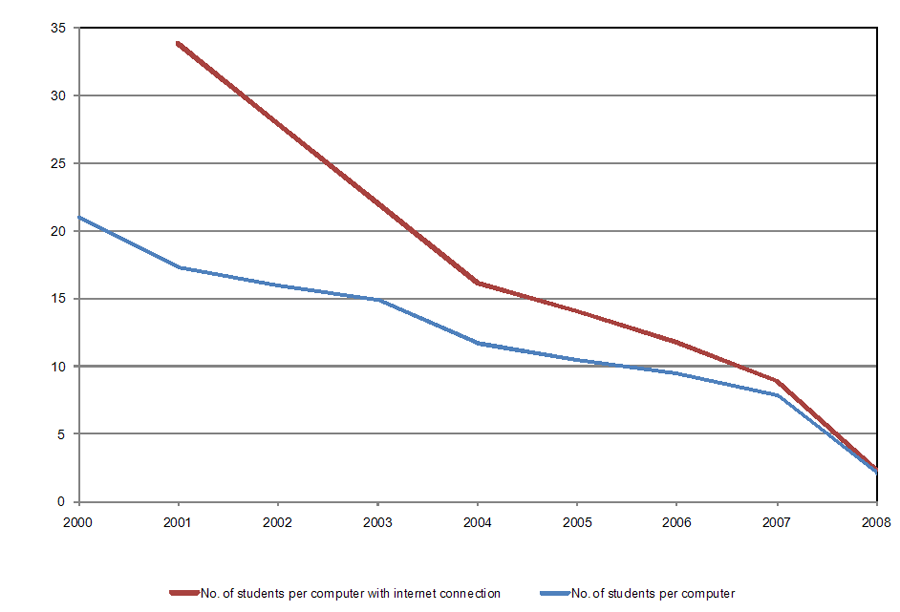
Source: GEPE - Office for Education Statistics and Planning.
See all Education and Training graphs and tables >>
Society and Citizenship
Internet Penetration in the Population Total and Broadband: total, cable+optical fibre+mobile(active users), optical fibre+mobile (active users), mobile (active users)
%, Customers in the total population, in each semester
Alternative access:
click the image below to amplify
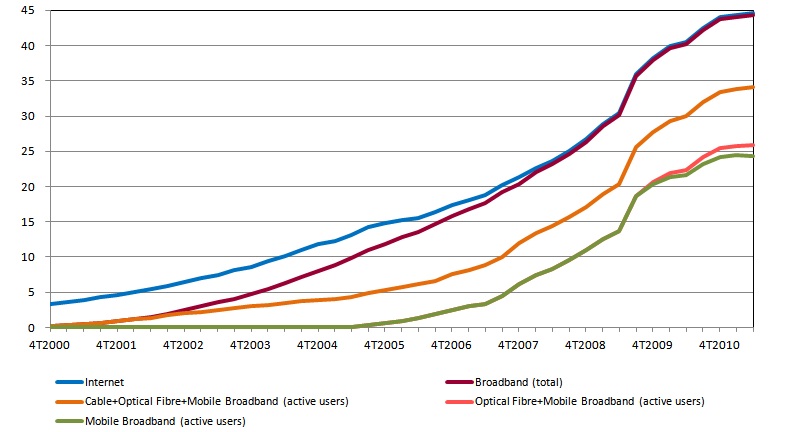
Notes: Blank entries have values calculated by linear interpolation for graphical representation purposes.
Active mobile broadband users refers to customers who can access to mobile broadband Internet
and actually connected to the Internet at least once in the preceding month.
Source: ANACOM.
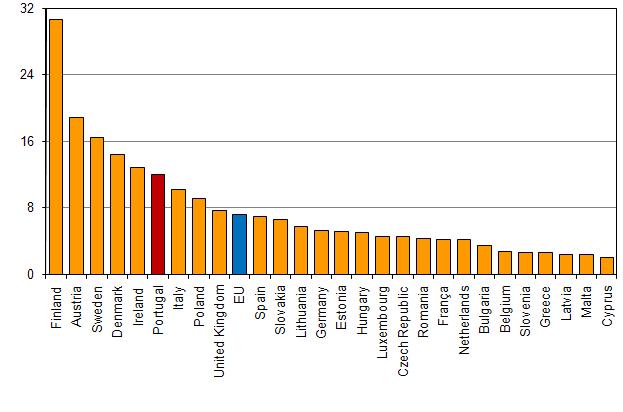
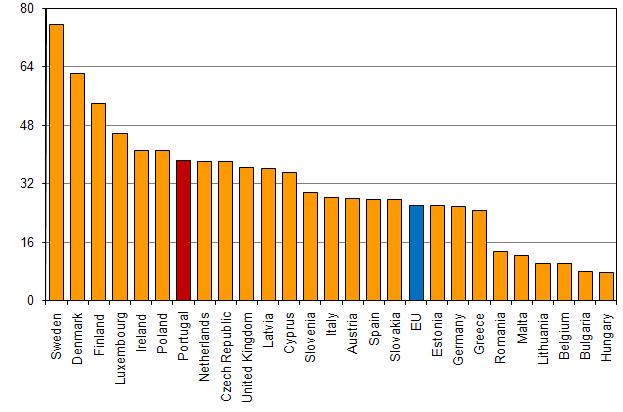
Broadband Penetration in the Population ≥ 10 Mbps in EU Member States
1st January 2011, (%)
Alternative access:
click the image below to amplify

Note: Data for Austria is of 1 July 2009 (latest available data).
Source: COCOM, DG INFSO, European Commission, June 2011.
Mobile Broadband Penetration in the Population in EU member states - Dedicated data service (cards, modems, keys only)
1st January 2011, (%)
Alternative access:
click the image below to amplify
Source: COCOM, DG INFSO, European Commission, June 2011.
Active Mobile Broadband Penetration in the Population in EU Member States
1st January 2011, (%), Number of customers (residential and nonresidential) who actually used mobile broadband in the past month per 100 inhabitants
Alternative access:
click the image below to amplify
Note: No data available for France.
Source: COCOM, DG INFSO, European Commission, June 2011.
Internet Penetration in the Households (Total and Broadband)
%, Households with at least one person aged from 16 to 74.
Alternative access:
click the image below to amplify
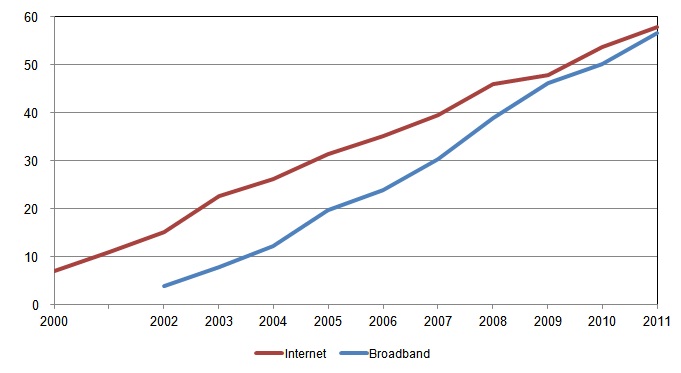
Source: EUROSTAT.
Computer Penetration in the Households (All and Laptops)
%, Households with at least one person aged from 16 to 74 (1st quarter of each year).
Alternative access:
click the image below to amplify
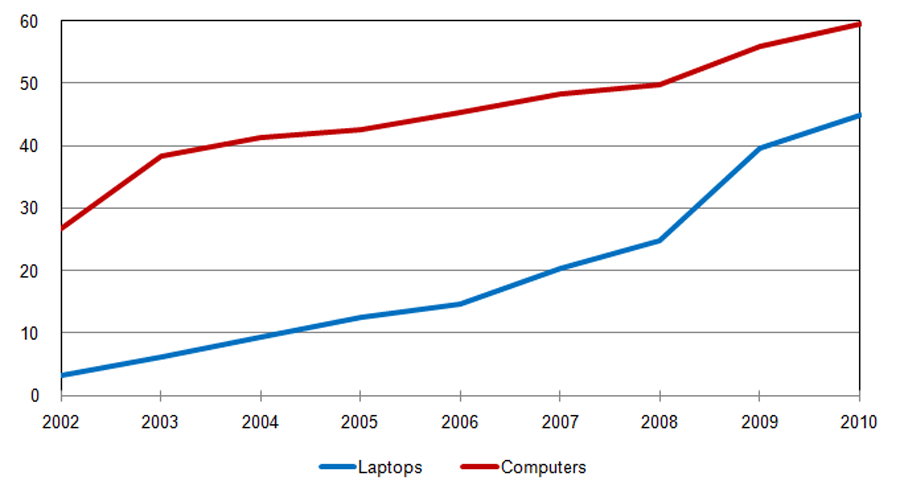
Source: EUROSTAT.
Acute Hospitals eHealth Profile
2010, (%)
Alternative access:
click the image below to amplify
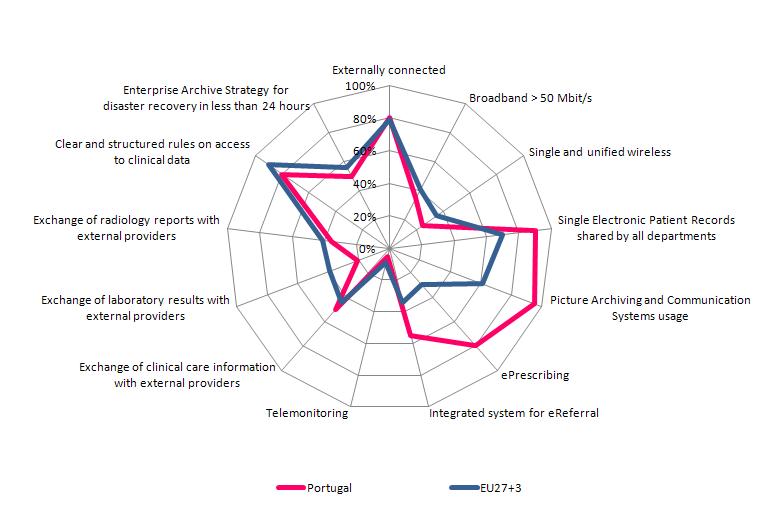
Note: EU27+3 refers to the EU27 Member States together with Croatia, Iceland and Norway.
Source: eHealth Benchmarking III, Commissioned to Deloitte by DGINFSO, European Commission.
See all Society and Citizenship graphs and tables >>
Inclusion and Accessibility
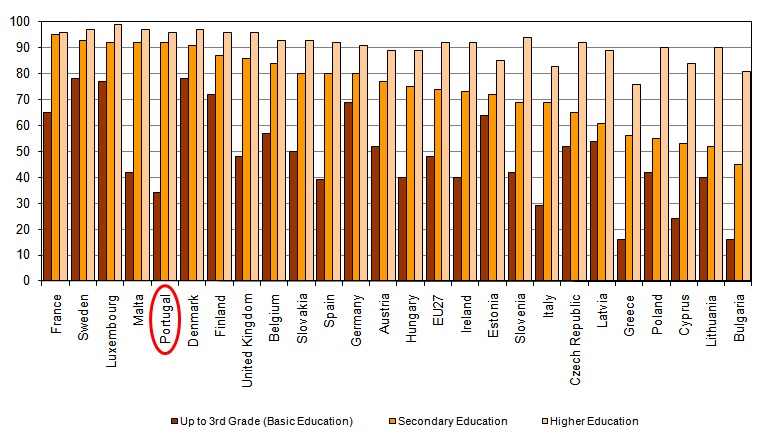
Internet users by complete education level in the EU Member States
2010, (%) People from 16 to 74 years old.
Alternative access:
click the image below to amplify
Note: Data refer to 1st quarter of each year.
Source: EUROSTAT.
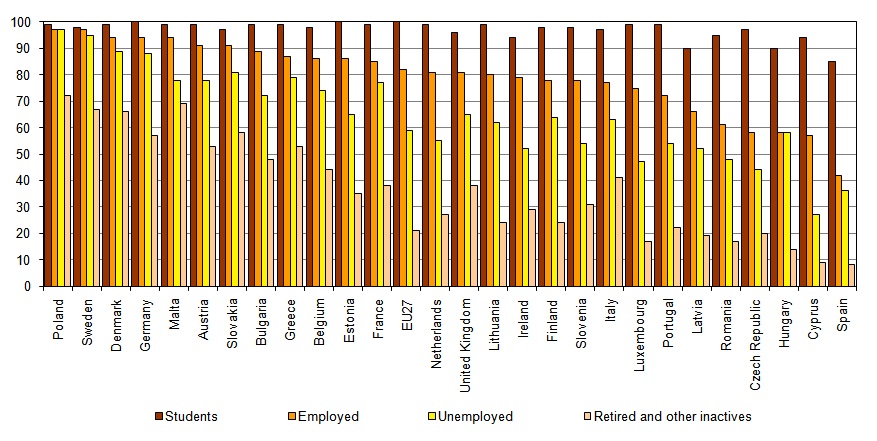
Internet users by main occupation among EU Member States
2010, (%) People from 16 to 74 years old
Alternative access:
click the image below to amplify
Note: Data refer to 1st quarter of the year.
Source: EUROSTAT.
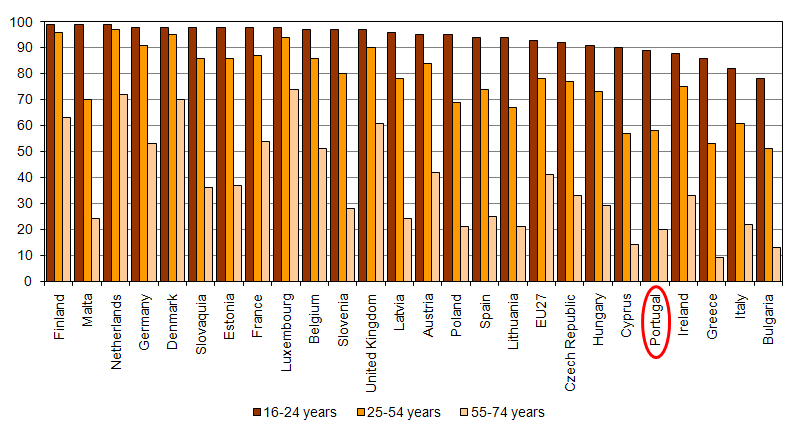
Internet users by age groups in EU Member States
2010, (%) people from 16 to 74 years old.
Alternative access:
click the image below to amplify
Note: Data refer to 1st quarter of each year.
Source: EUROSTAT.
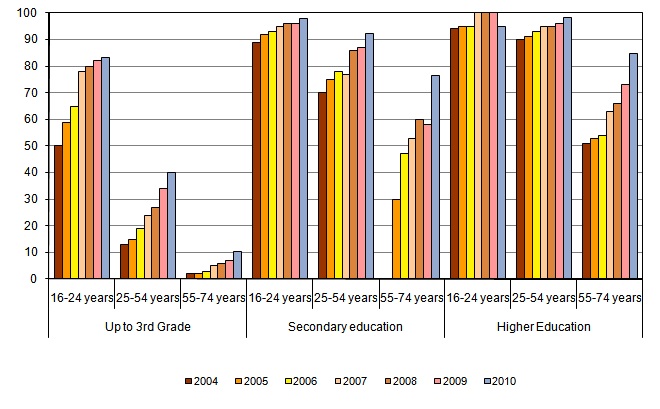
Internet users, by age and complete education level
(%) Total population in each group
Alternative access:
click the image below to amplify
Note: Data refer to 1st quarter of each year.
Source: EUROSTAT.
Internet users, by age and educational attainment, in Portugal and EU27, on 2006 and 2010
(%) Total population in each group
Alternative access:
click the image below to amplify
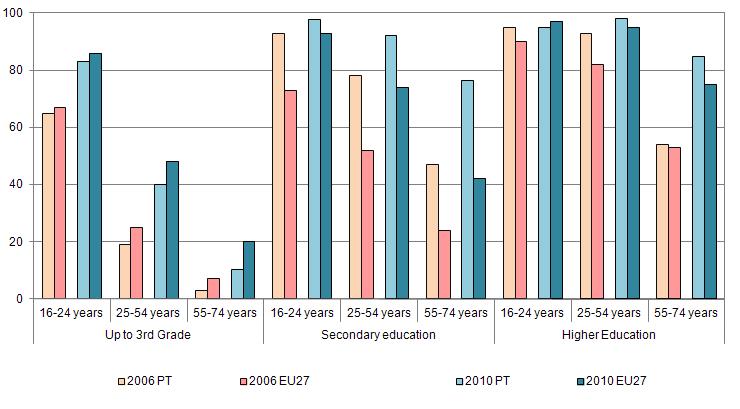
Note: Data relative to the 1st quarter of each year.
Source: EUROSTAT.
See all Inclusion and Accessibility graphs and tables >>
e-Science
International Connectivity of the RCTS - Science Technology and Society Network (2002-2008)
Giga bits per second (Gps), in July of each year
Alternative access:
click the image below to amplify
Source: UMIC - Knowledge Society Agency, IP, based on information from FCCN - Foundation for National Scientific Computation.
Jobs of GRID Computing performed in Portugal sites within the project EGEE - Enabling Grids for E-sciencE in Europe / EGI - European Grid Infrastructure
Number of Jobs.
Alternative access:
press the image below to enlarge this
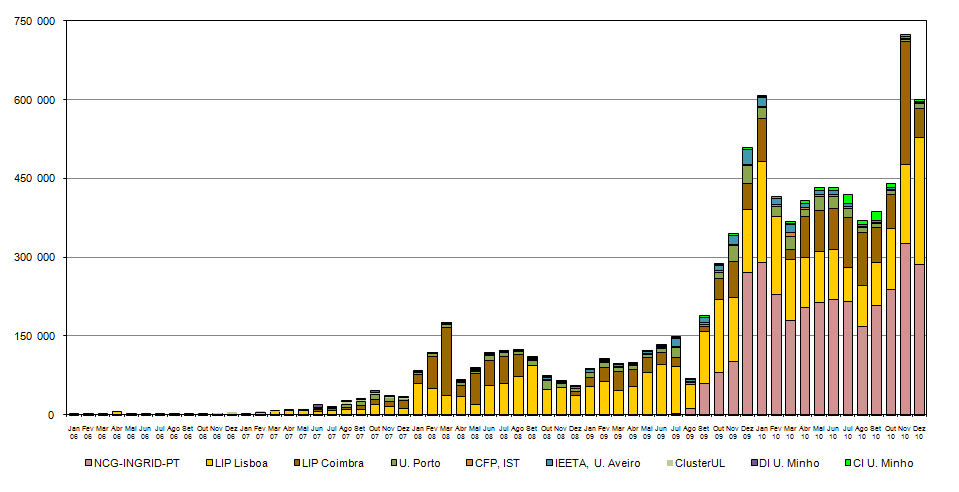
Source: EGEE Accounting Portal.
CPU Time of Grid Computing performed in Portugal sites within the project EGEE - Enabling Grids for E-science in Europe / EGI - European Grid INfrastructure
CPU time.
Alternative access:
press the image below to enlarge this
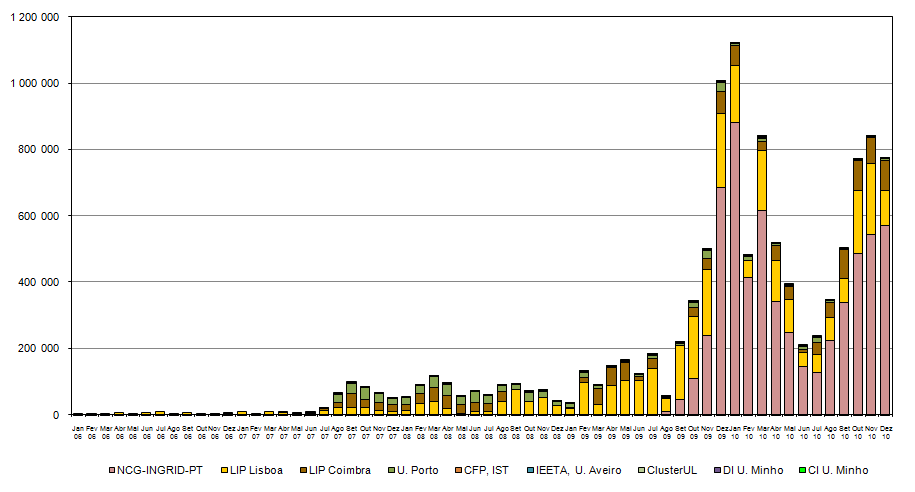
Source: EGEE Accounting Portal.
Documents in Scientific Open Access Repositories in Portugal
No. of documents at the end of each year
Alternative access:
click the image below to amplify
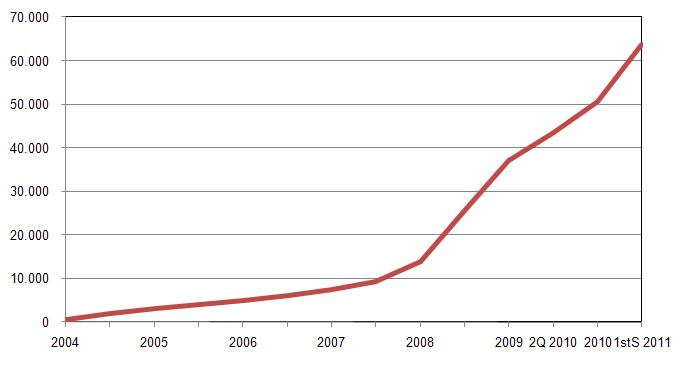
Source: Knowledge Society Agency (UMIC).
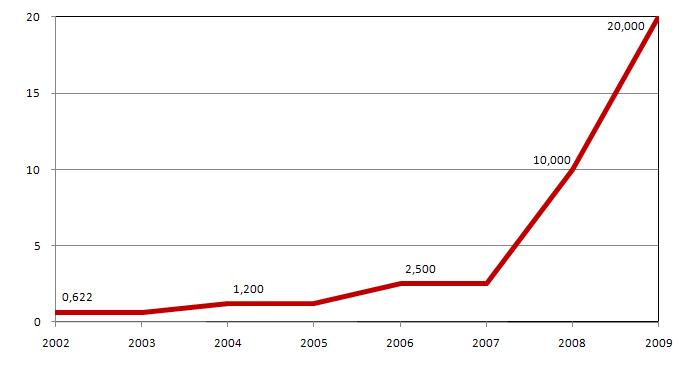
Institutional Repositories in the Open Access Scientific Repository of Portugal
Number of institutional repositories at the end of each year
Alternative access:
click the image below to amplify
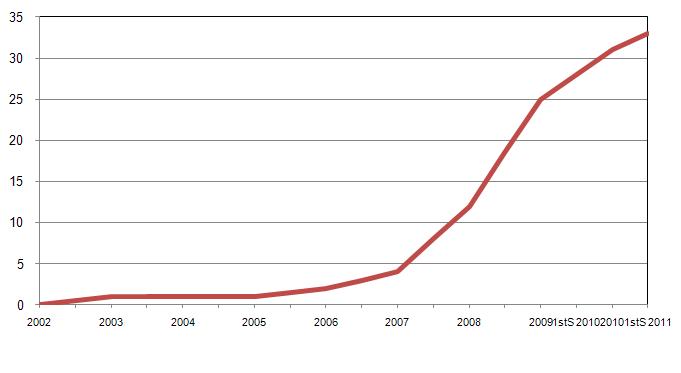
Source: Knowledge Society Agency (UMIC).
Distribution of access to the Linguateca website (http://www.linguateca.pt/) by geographical origin
Accumulated hits from July 1998 to November 2008 from top regional domain address 2008
Total number of regional domain hits = 1.592.071, Total number of hits = 8.546.599
Alternative access:
click the image below to amplify
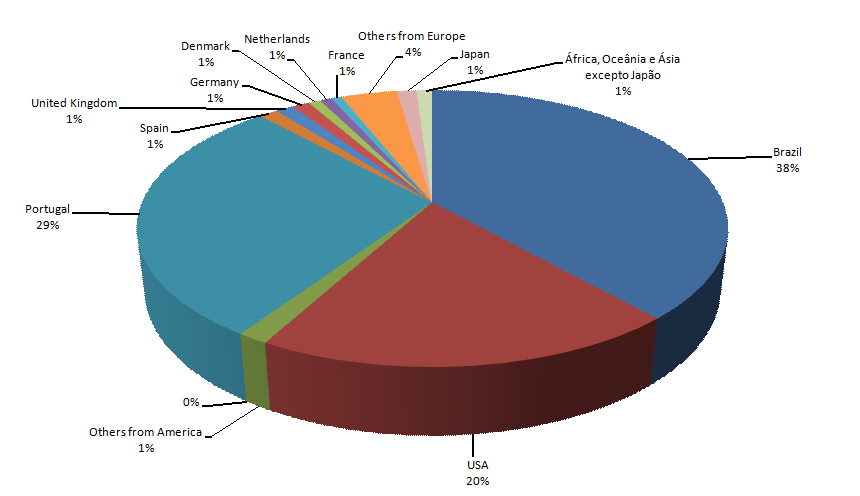
Source: Linguateca.
See all e-Science graphs and tables >>
Knowledge
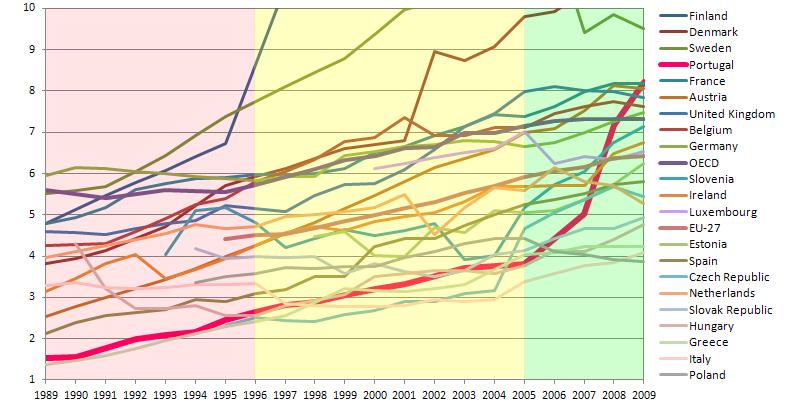
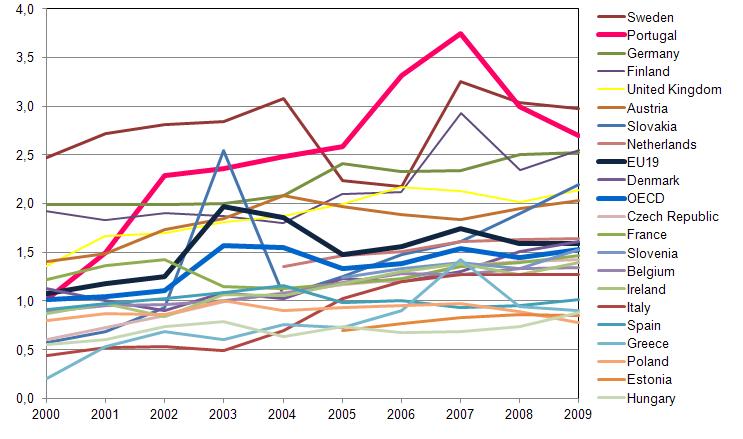
Evolution of the percentage of R&D expense in GDP for EU Member States with values between 0.5% and 2%
%
Alternative access:
click the image below to amplify
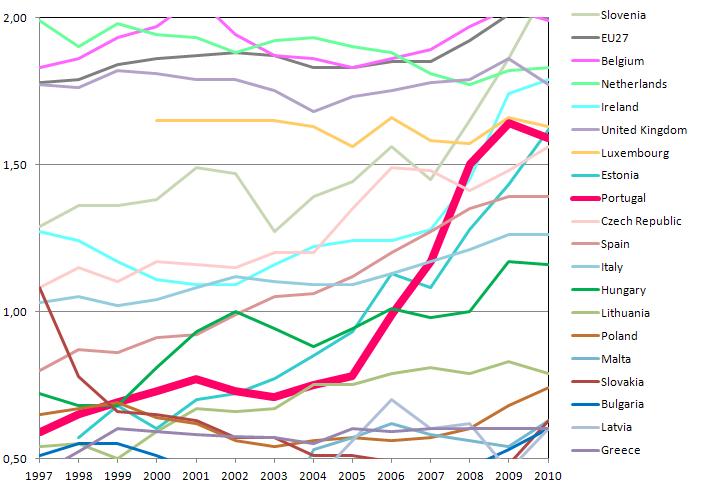
Source: EUROSTAT, Dec. 2010.
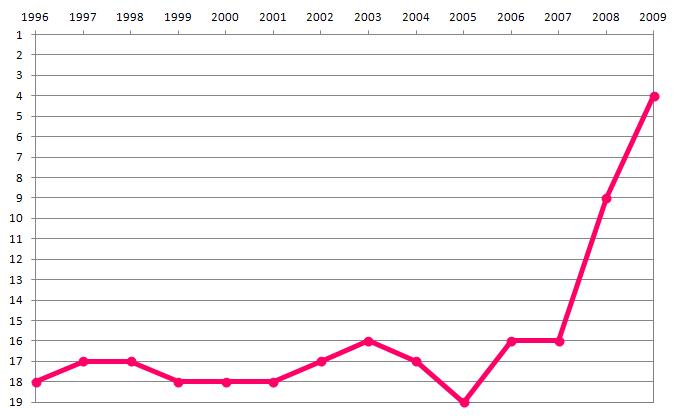
Evolution of the rank of Portugal in percentage of R&D expense in GDP within EU27
Rank within EU Member States
Alternative access:
click the image below to amplify
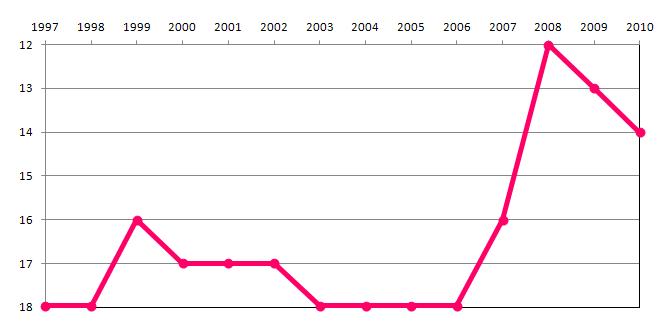
Source: EUROSTAT, Dec. 2010.
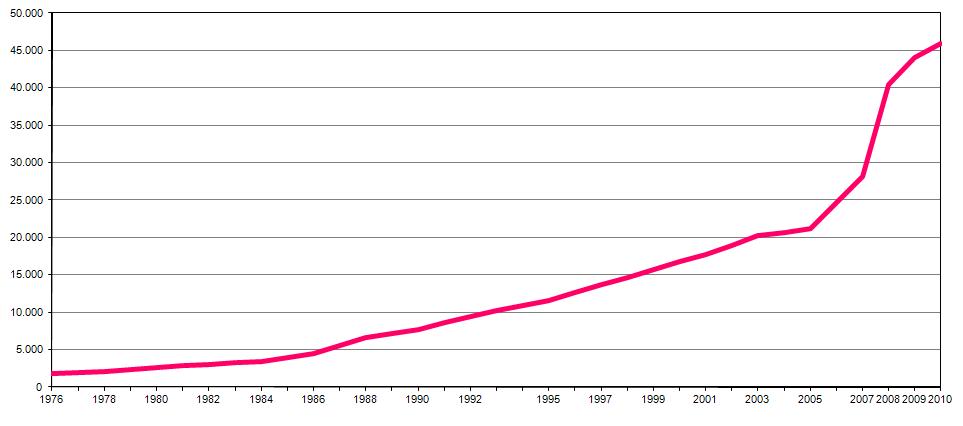
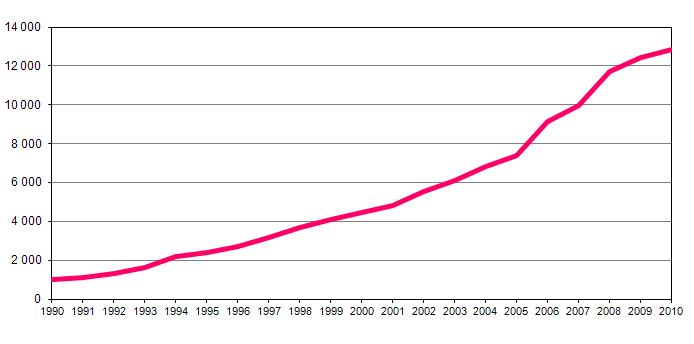
Budget allocations for the main public institutions providing competitive funding for grants, projects, R&D institutions and infrastructures - JNICT/FCT + IICT/GRICES + UMIC (I&D) + UMIC (I&D)
(National and Community funds)
Million Euros, constant prices 2011
Alternative access:
click the image below to amplify
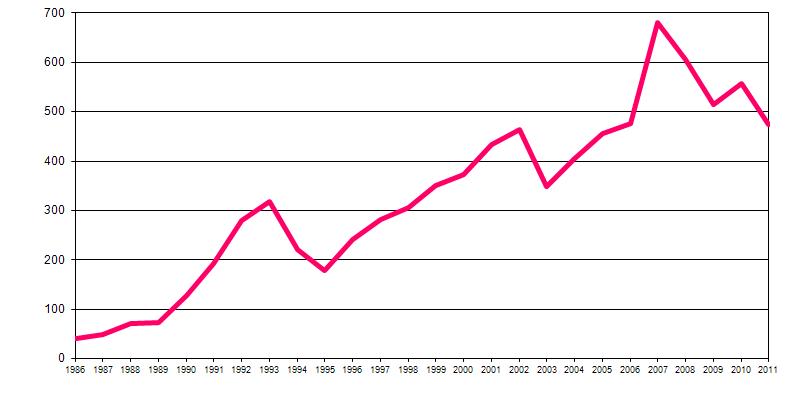
Note: Budget allocations for the JNICT until 1997, the FCT from 1997 to 2008, plus ICCTI budgetary allocations from 1998 to 2002 and from GRICES from 2003 to 2007 (international S&T cooperation responsibilities moved from the JNICT to ICCTI in 1997, then to GRICES in 2003 and to the FCT in 2007), and also the POSI/POSC and UMIC R&D budget allocations.
It was used the GNP deflactor of OECD.
Source: OCT/OCES/GPEARI MCTES - Statistics
Total R&D Public Budget
(National and Community funds)
Million Euros, constant prices of 2011
Alternative access:
click the image below to amplify
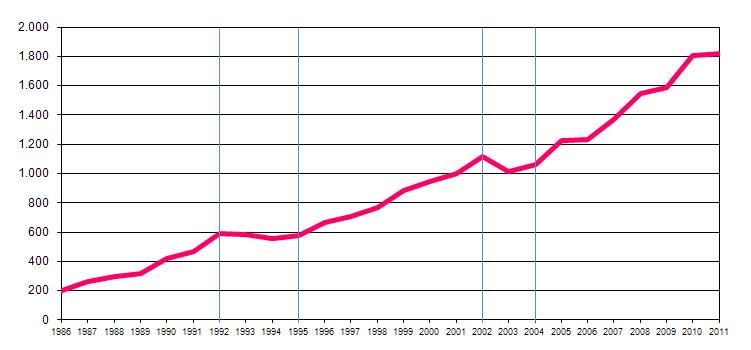
Source: OCT/OCES/GPEARI MCTES - Statistics.
Percentage of Public R&D Budget in Total Public Budget
(National and Community Funds),
%
Alternative access:
click the image below to amplify
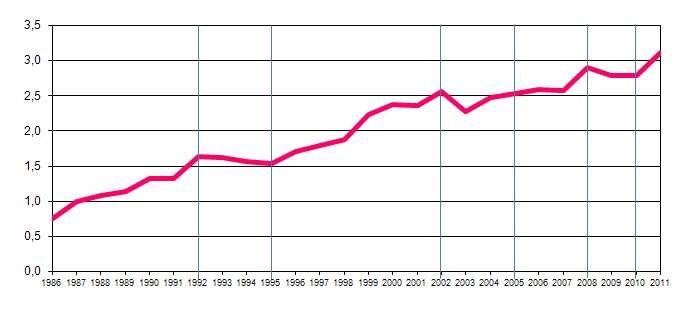
Source: OCT/OCES/GPEARI MCTES - Statistics, DGO.
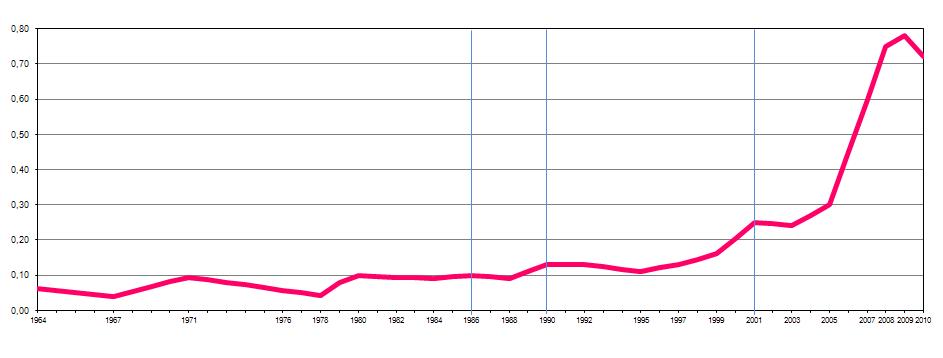
Percentage of Total R&D Spending in GDP of Portugal
%
Alternative access:
click the image below to amplify

Source: OCDE.
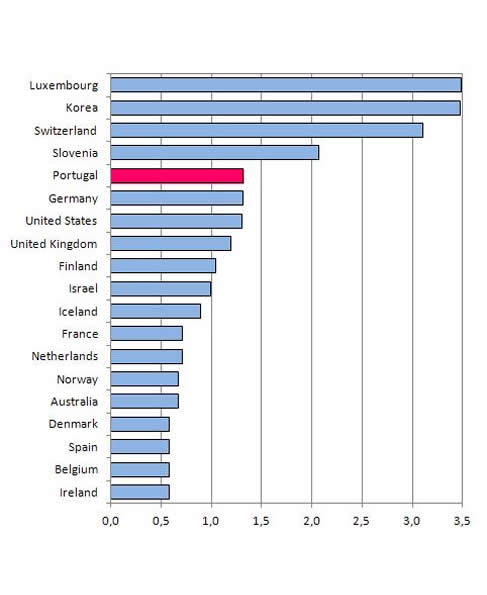
Percentage of R&D Spending in Enterprises in the GDP, in Portugal
%
Alternative access:
click the image below to amplify
Source: OCDE.
Evolution of the number of FTE researchers per thousand population for EU Member States with values between 1 and 10
Alternative access:
click the image below to amplify
Notes: Value of France for 2009 is that of 2008 and values of Greece for 2008 and 2009 are taken equal to that of 2007, in both cases the last available data.
For graphical purposes intermediate values between given data are interpolated linearly.
Source: OECD, Main Science and Technology Indicators, February 2011.
Evolution of the rank of Portugal in number of FTE researchers per thousand active population within EU27
Alternative access:
click the image below to amplify
Source: OECD, Main Science and Technology Indicators, February 2011.
Number of Researchers (FTE) in Portugal
Number of researchers (FTE)
Alternative Access:
click the image below to amplify
Note: Values where linearly interpolated for graphical purposes when needed.
In 2008 the survey method was changed in order to include also higher education researchers who were not integrated in R&D units evaluated and funded by the FCT.
Source: OCDE.
Number of scientific publications by year of authorship or co-authorship of portuguese researchers (considered in the InCitesTM, Thomson Reuters (2010))
Number of publications
Alternative access:
click the image below to amplify
Notes:
1) Data computed by the fractional method with basis on the "InCitesTM, Thomson Reuters (2010)";
2) The values for 2010 are considered provisional.
Source: GPEARI - Planning, Strategy, Evaluation and International Relations Office / Ministry of Science, Technology and Higher Education.
Share of R&D spending by sector in 2010
2010, (%).
Alternative access:
click the image below to amplify
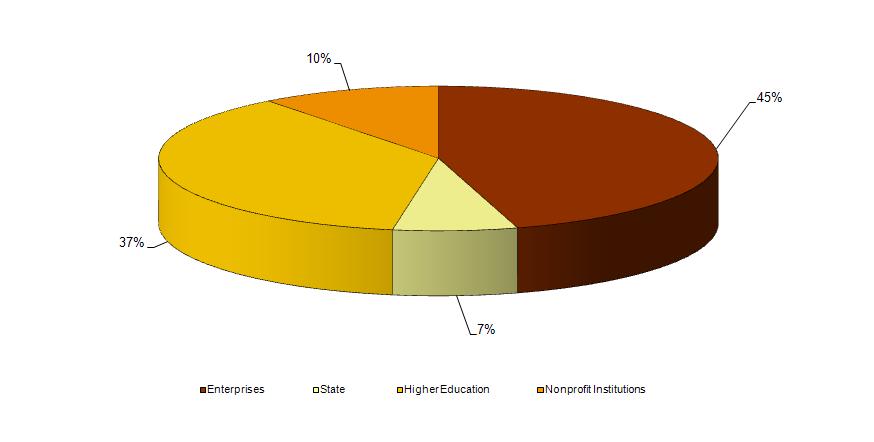
Fonte: OCT/OCES/GPEARI - Statistics.
Share of R&D spending by implementing sector in 1995
1995, (%).
Alternative access:
click the image below to amplify
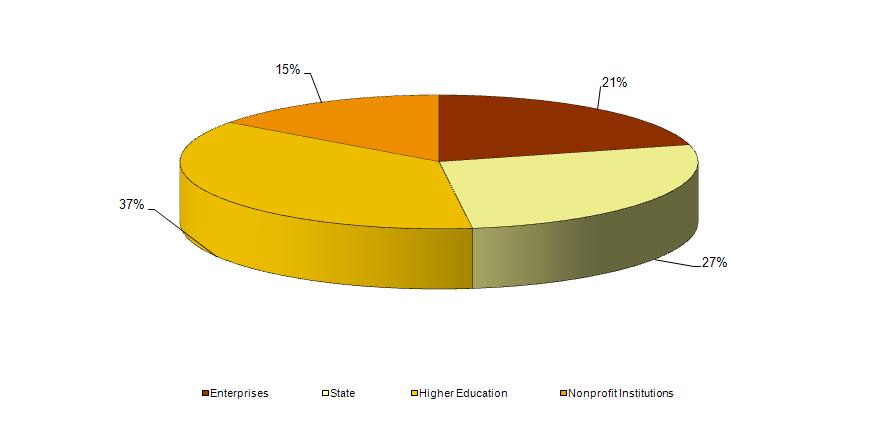
Source: OCT/OCES/GPEARI MCTES - Statistics.
Percentage of total R&D spending in GDP
2009, (%)
Alternative access:
click the image below to amplify
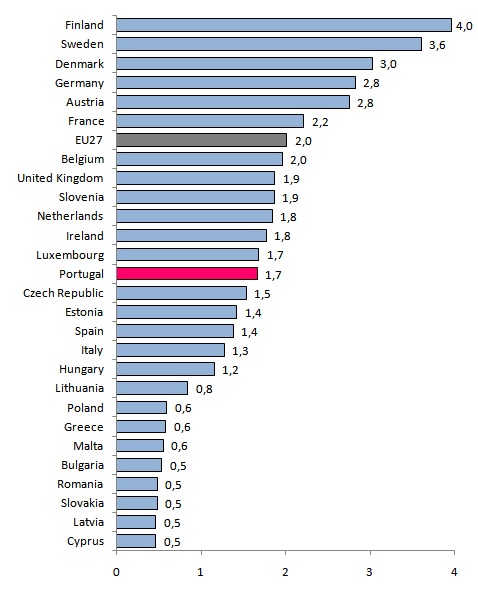
N.B.: Data used for Greece in 2009 are those of 2007, the most recent available.
Source: EUROSTAT, Dec. 2010.
Average annual growth of the percentage of total R&D spending in GDP of Portugal from 2005 to 2009
(%)
Alternative access:
click the image below to amplify
Note: Data used for Greece for 2009 are from 2008, the most recent available.
Source: EUROSTAT, Dec, 2010.
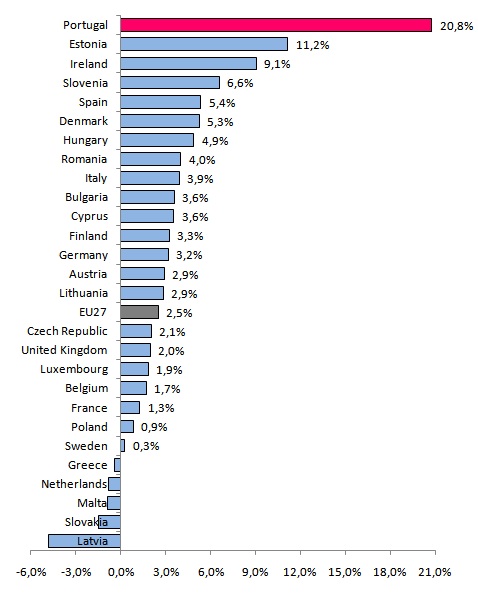
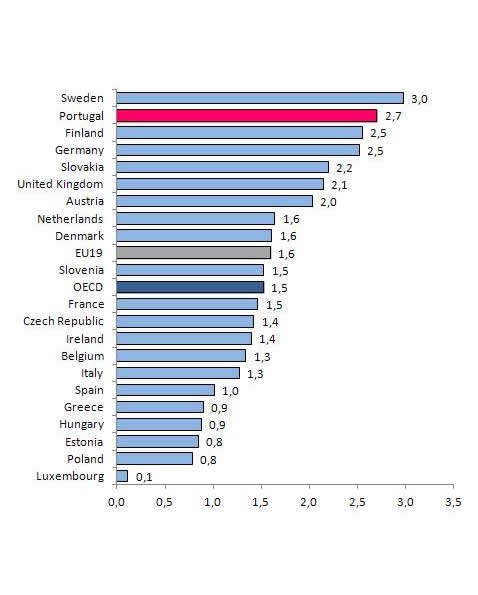
R&D Public Budget as a percentage of GNP in EU Member States
2009, (%)
Alternative access:
click the image below to amplify
Note: Data of Greece for 2009 is from 2007, the last available data.
Source: EUROSTAT, Dec. 2010.
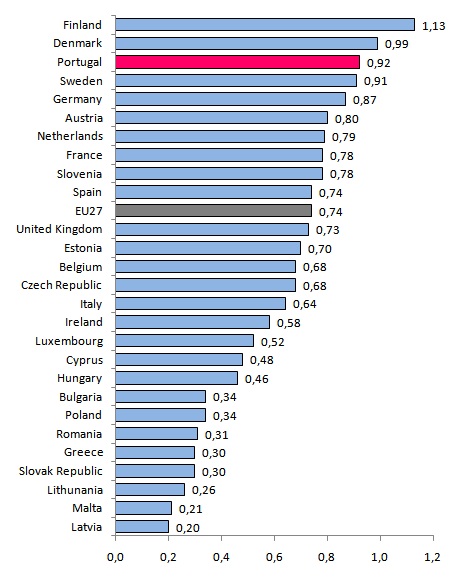
Researchers (FTE) per 1,000 active population
2009, ()
Alternative access:
click the image below to amplify
Note: The value for France in 2009 is that of 2008 and the value for Greece in 2008 and 2009 is that of 2007; in both cases the most recent available.
Source: OECD, Main Science and Technology Indicators, February 2011.
Average annual growth of the number of researchers (FTE) per 1,000 active population in EU Member States, from 2005 to 2009
(%)
Alternative access:
click the image below to amplify
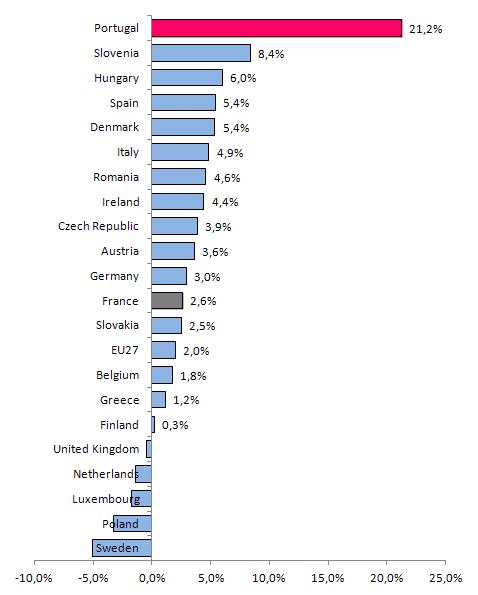
Note: The values for France and Greece in 2009 are those of 2008 and 2007, respectively.
Source: OECD, Main Science and Technology Indicators, February 2011.
Accumulated number of PhDs in Portugal and abroad but recognised by Portuguese Universities since 1970
Total number of PhDs awarded
Alternative access:
click the image below to amplify
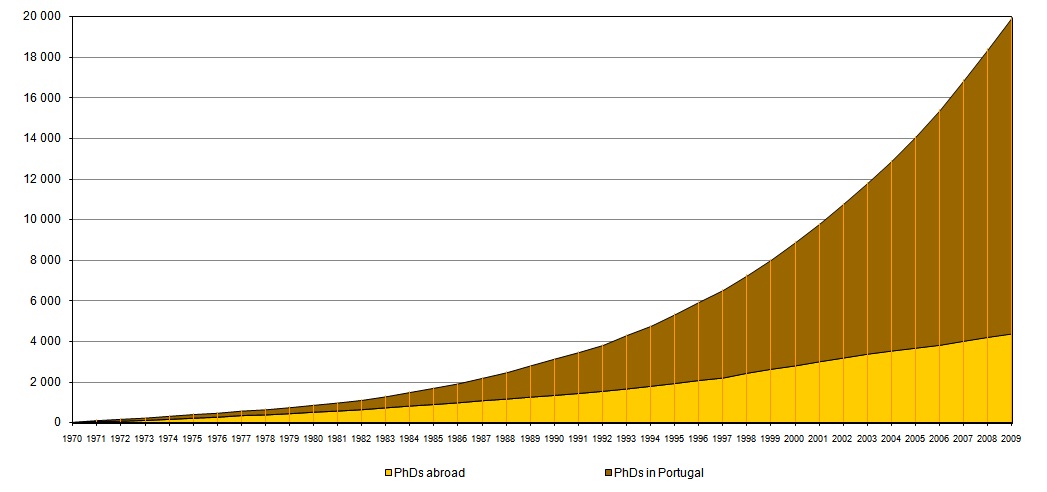
Source: OCT/OCES/GPEARI Statistics, Ministry of Science, Technology and Higher Education.
PhDs from or recognised by Portuguese Universities
Number of Doctorates
Alternative access:
click the image below to amplify
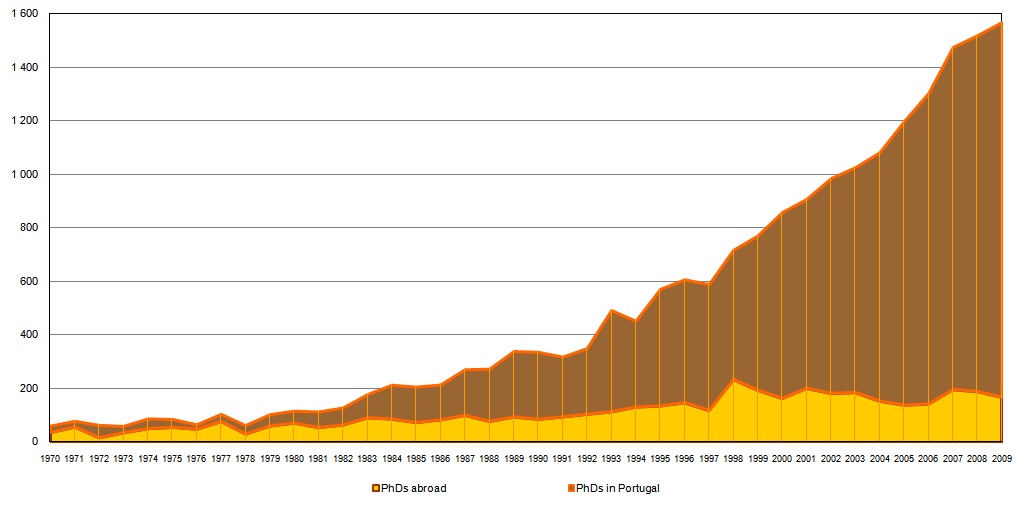
Source: OCT/OCES/GPEARI Statistics, Ministry of Science, Technology and Higher Education.
PhD and Post-Doc fellowships awarded annually by FCT
Number of fellowships awarded
Alternative access:
click the image below to amplify
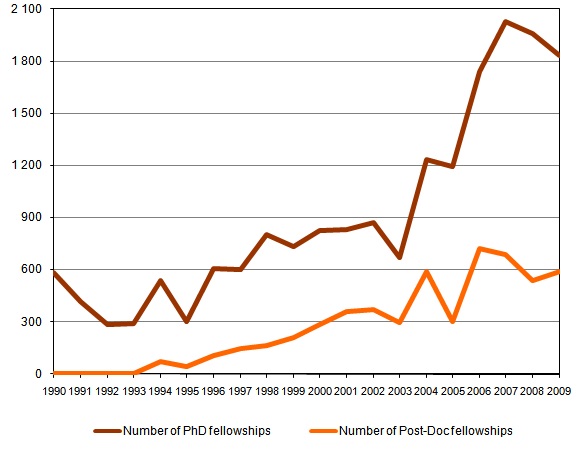
Source: OCT/OCES/GPEARI Statistics, FCT.
PhD Students in S&T* in the 20-29 years old population cohort, in EU Member States
2008, (%)
Alternative access:
click the image below to amplify
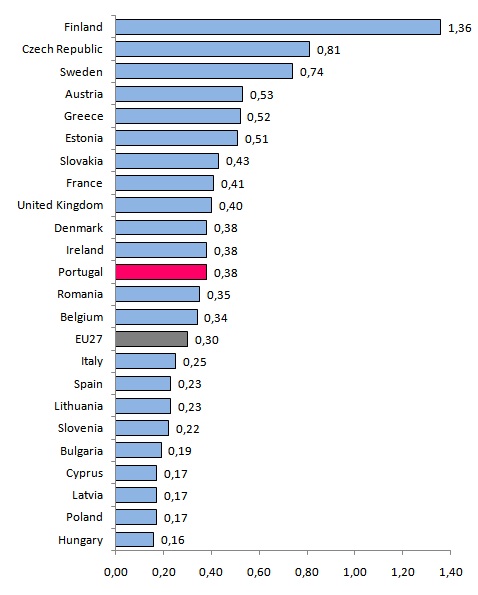
Note: No data available for Germany, Netherlands and Luxembourg
Data for Italy and EU27 in 2008 are from 2007, the last available data.
* Sciences, Mathematics, Computer Science, Engineering
Source: EUROSTAT, Jan. 2009.
Percentage of PhD's obtained in EU countries in the corresponding age bracket
2009, (%)
Alternative access:
click the image below to amplify
Note: The values for EU19, Greece and Luxembourg in 2009 are those of 2008; the values for Italy in 2008 and 2009 are those of 2007; in both cases the most recent available.
Source: OECD, Science, Technology and Industry Scoreboard 2011.
Percentage of PhD's obtained by women in EU countries
2009, (%)
Alternative access:
click the image below to amplify
Source: OECD, Science, Technology and Industry Scoreboard 2011.
Percentage of PhD's obtained in EU countries in the corresponding age brackets
%
Alternative access:
click the image below to amplify
Note: The values for EU19, Greece and Luxembourg in 2009 are those of 2008; the values for Italy in 2008 and 2009 are those of 2007; in both cases the most recent available..
Source: OECD, Science, Technology and Industry Scoreboard 2011.
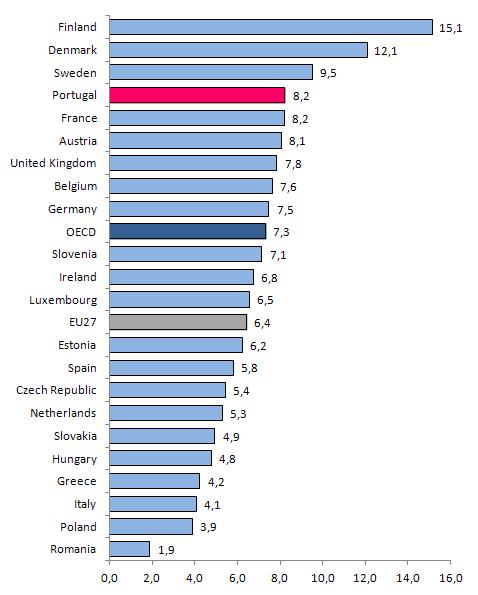
Percentage of Population with PhD in Some OECD Member States and Partner Economies
2009, (%) Population 26-64 years old
Alternative access:
click the image below to amplify
Source: Education at a Glance 2011, OECD.
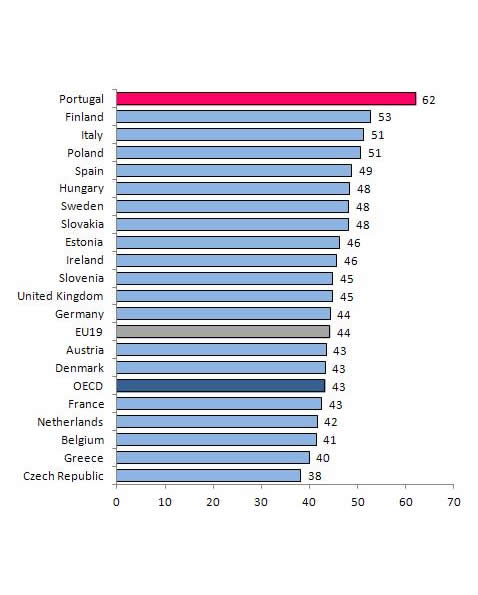
Women Researchers in the Total of Researchers in EU Member States
2009, (%)
Alternative access:
click the image below to amplify

Note: The value for Greece in 2009 is that of 2005, the last one available.
Source: EUROSTAT, Dec. 2011.
See all Knowledge graphs and tables >>
Enterprise
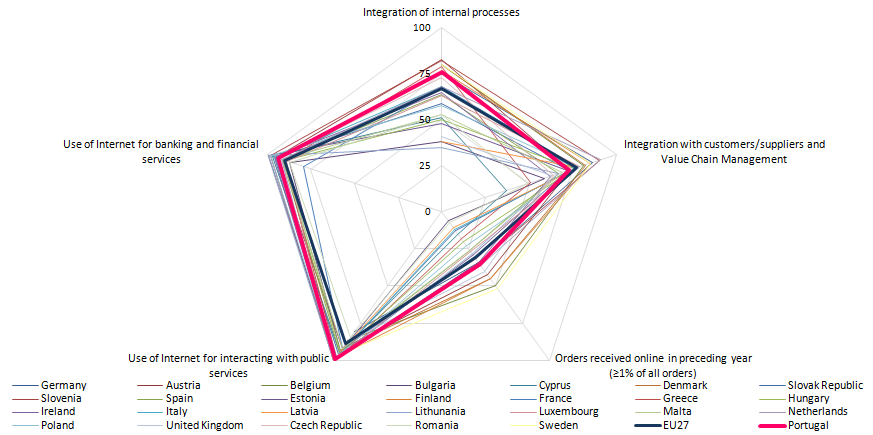
eBusiness in Large Enterprises of EU Member States
(without financial sector)
2010, 1st quarter (%)
Alternative access:
click the image below to amplify
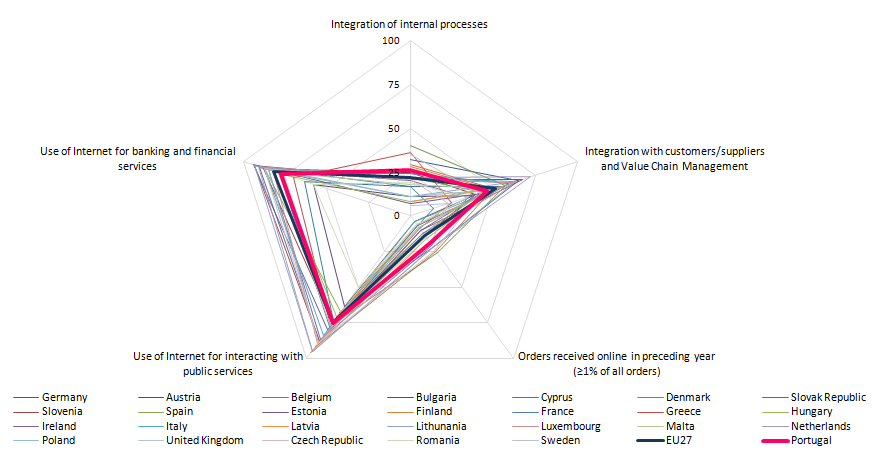
eBusiness in all enterprises of EU Member States
(SMEs and Large Enterprises, without financial sector)
2010, 1st quarter (%)
Alternative access:
click the image below to amplify
Enterprises receiving orders online
% enterprises
Alternative access:
click the image below to amplify
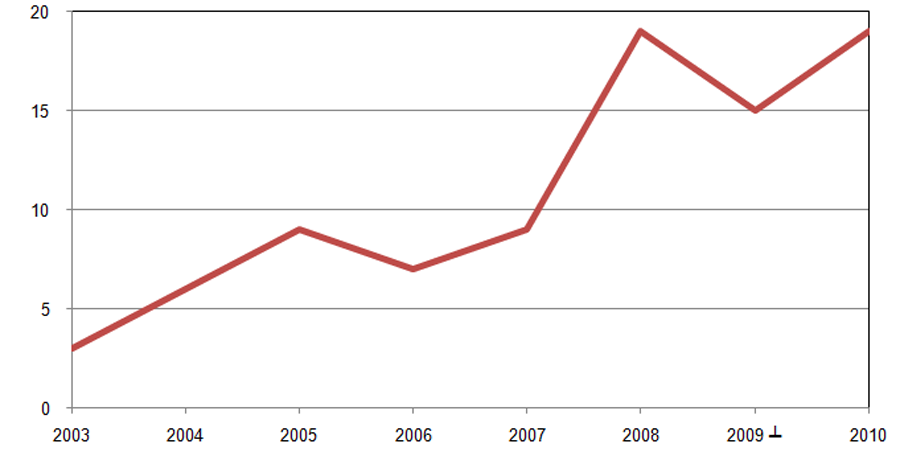
┴ Break of series from 2008 to 2009, following and harmonization in the EU, which included the enlargement of the economic actiities previously
considered in the survey, namely by encluding "restauration" and "electricity, gas and vapor, water supply, sewage, residue management",
among others.
Source: Knowledge Society Agency (UMIC).
See all Enterprise graphs and tables >>
Public Services
User Experience of e-Government Services Delivery
2010, (%)
Alternative access:
click the image below to amplify
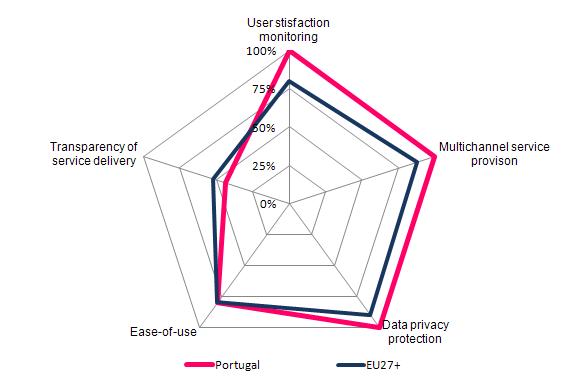
Fonte: eGov Benchmarking Report 2010, DGINFSO, EC
User Experience of e-Government Portals
2010, (%)
Alternative access:
click the image below to amplify
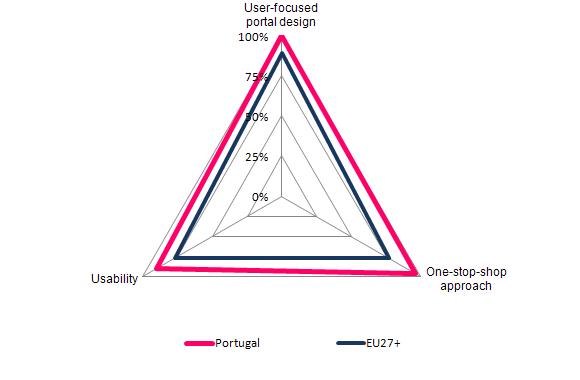
Fonte: eGov Benchmarking Report 2010, DGINFSO, EC
e-Procurement Pre-Award Process
2010, (%)
Alternative access:
click the image below to amplify
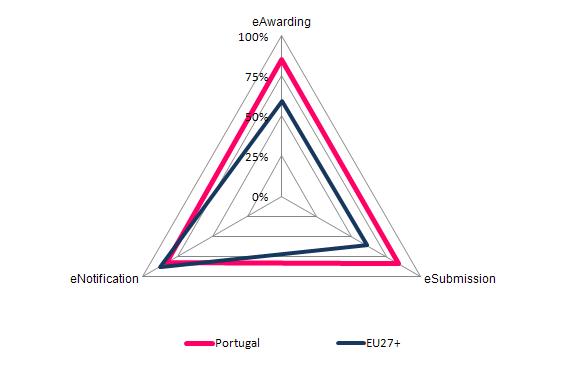
Fonte: eGov Benchmarking Report 2010, DGINFSO, EC
Progress of Portugal position in the Rankings of online Public Services availability among EU15 countries
2001 to 2009, Ranking.
Alternative access:
click the image below to amplify
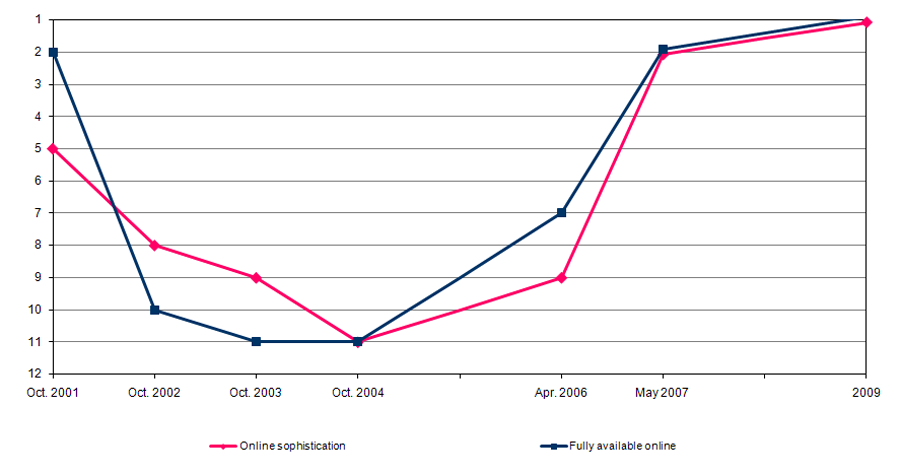
Source: Capgemini Reports prepared for the Information Society and Media Directorate-General, European Commission.
Progress of full availability of basic Public Services online indicator
2001 to 2009 (Score %)
Alternative access:
click the image below to amplify
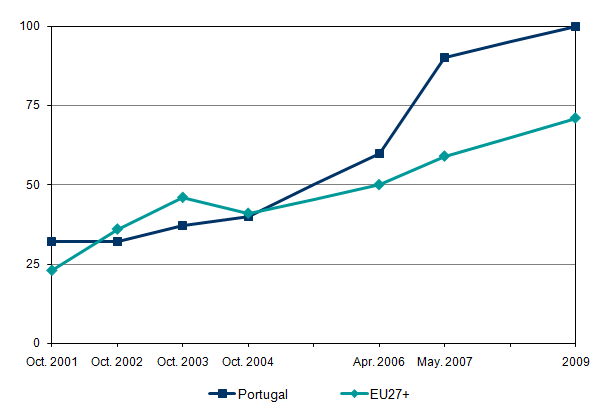
Source: Capgemini Report prepared for the Information Society and Media Directorate-General, European Commission.
Sophistication of basic public services online
2009, (%)
Alternative access:
click the image below to amplify
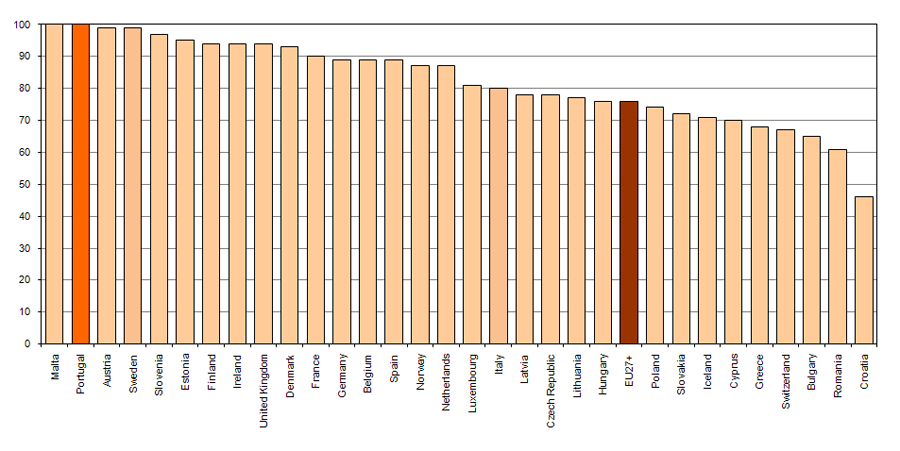
N.B.: UE27+ = UE27 + Croatia, Iceland, Norway e Switzerland.
Source: Capgemini Report prepared for the Information Society and Media Directorate-General, European Commission, November 2009.
Full availability of basic public services online
2009, (%)
Alternative access:
click the image below to amplify
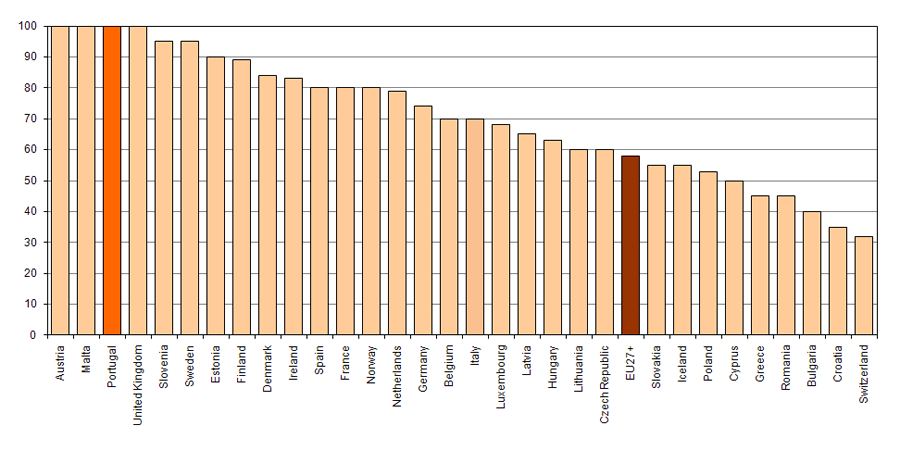
N.B.: UE27+ = UE27 + Croatia, Iceland, Norway e Switzerland.
Source: Capgemini Report prepared for the Information Society and Media Directorate-General, European Commission, November 2009.
Basic Public Services (Full Online Availability, Sophistication)
%, end of each year
Alternative access:
press the image below to amplify
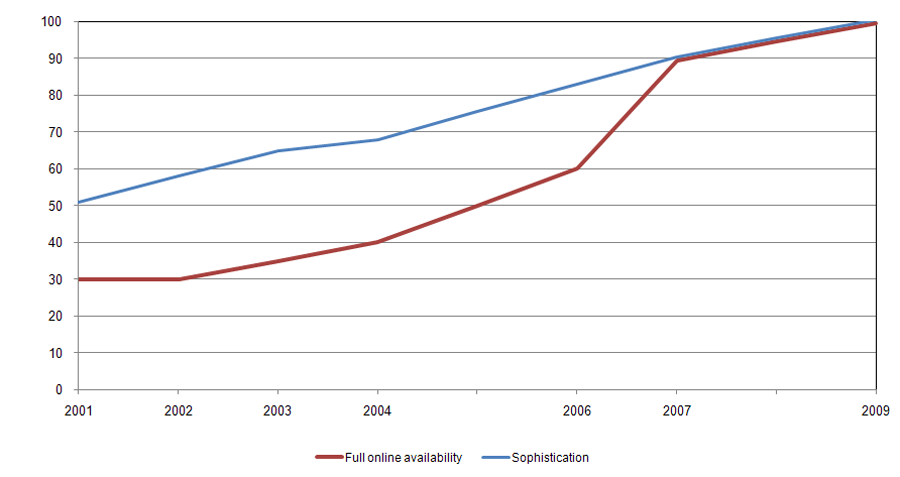
Source: Capgemini report prepared for the Directorate-General for the Information Society and Media of the European Commission.
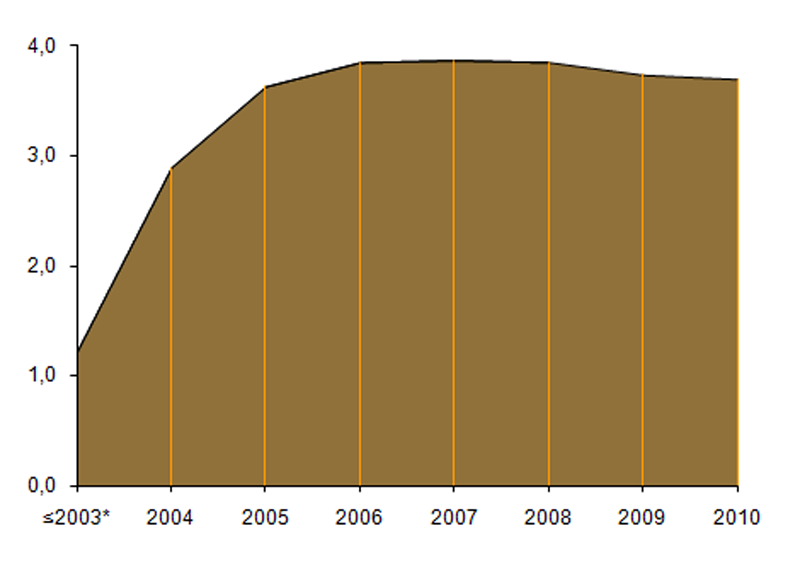
Number Income Tax (IRS) Declarations Submitted through the Internet
Millions of declarations
Alternative access:
press the image below to amplify
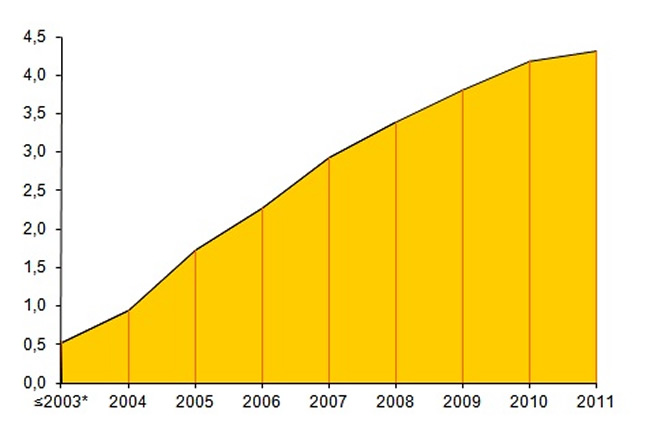
*Accumulated value.
Source: Direcção-Geral de Impostos, Portugal.
Number of Value Added Tax (VAT) Declarations Submitted through the Internet
Millions of declarations
Alternative access:
click the image below to amplify
*Accumulated value.
Fonte: Direcção-Geral de Impostos, Portugal.
Total value negotiated within the National Programme for eProcurement
2003 a 2006, (millions of Euros).
Alternative access:
Click on the image below to enlarge this
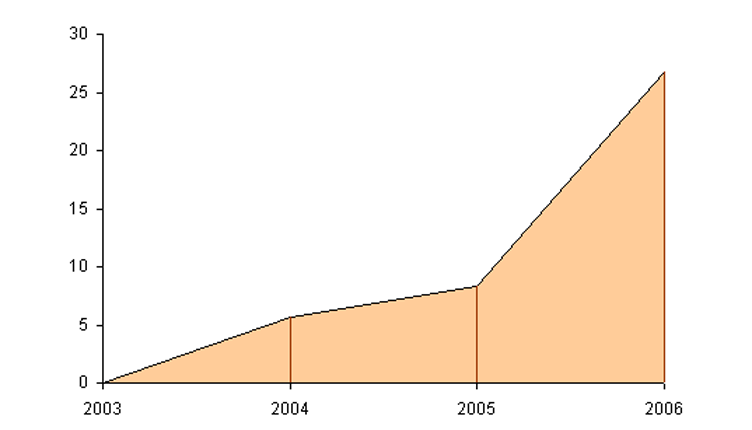
Source: UMIC - Knowledge Society Agency, P.I., July 2006.