

Graphs and Tables - Public Services
- 13/11/2008User Experience of e-Government Services Delivery
2010, (%)
Alternative access: 
click the image below to amplify
Fonte: eGov Benchmarking Report 2010, DGINFSO, EC
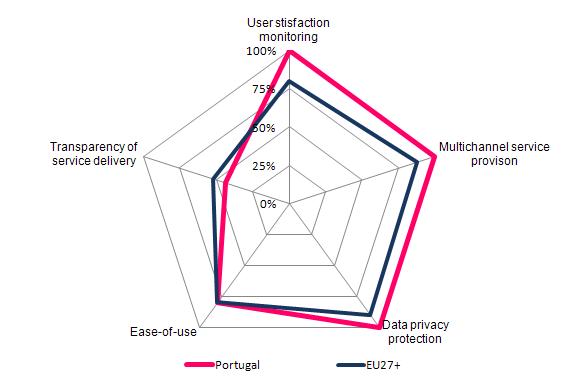
User Experience of e-Government Portals
2010, (%)
Alternative access:
click the image below to amplify
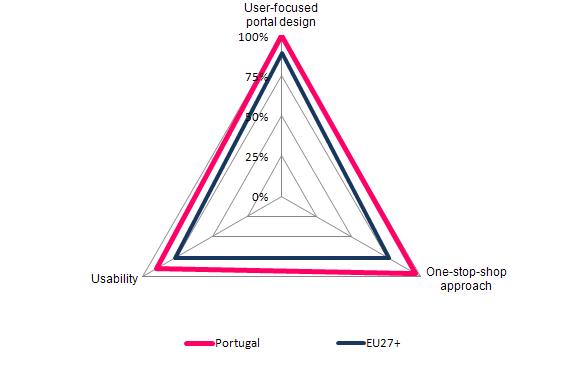
Fonte: eGov Benchmarking Report 2010, DGINFSO, EC
e-Procurement Pre-Award Process
2010, (%)
Alternative access:
click the image below to amplify
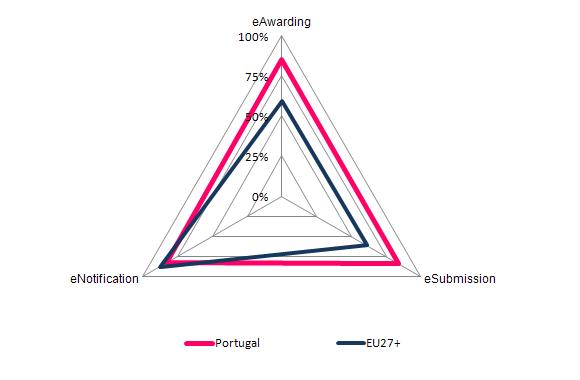
Fonte: eGov Benchmarking Report 2010, DGINFSO, EC
Progress of Portugal position in the Rankings of online Public Services availability among EU15 countries
2001 to 2009, Ranking
Alternative access:
click the image below to amplify
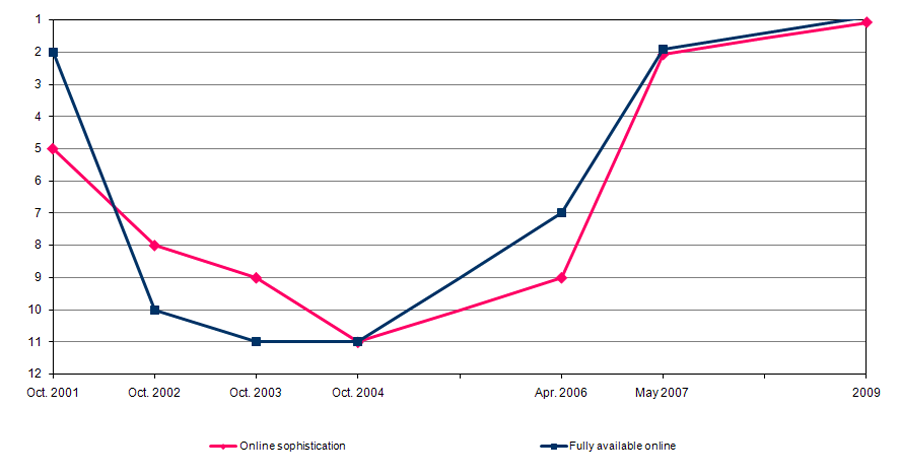
Source: Capgemini Reports prepared for the Information Society and Media Directorate-General, European Commission.
Progress of full availability of basic Public Services online indicator
2001 to 2009, (Score %)
Alternative access:
click the image below to amplify
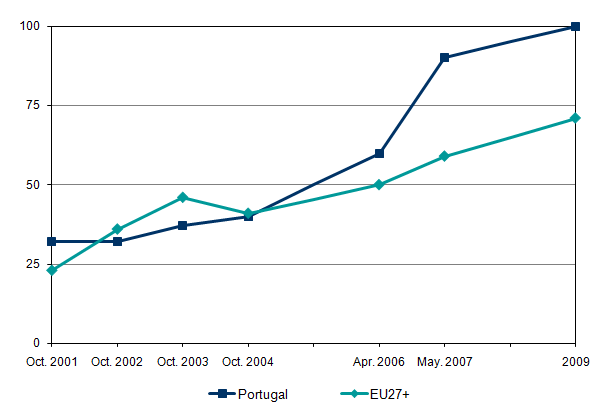
Source: Capgemini Report prepared for the Information Society and Media Directorate-General, European Commission.
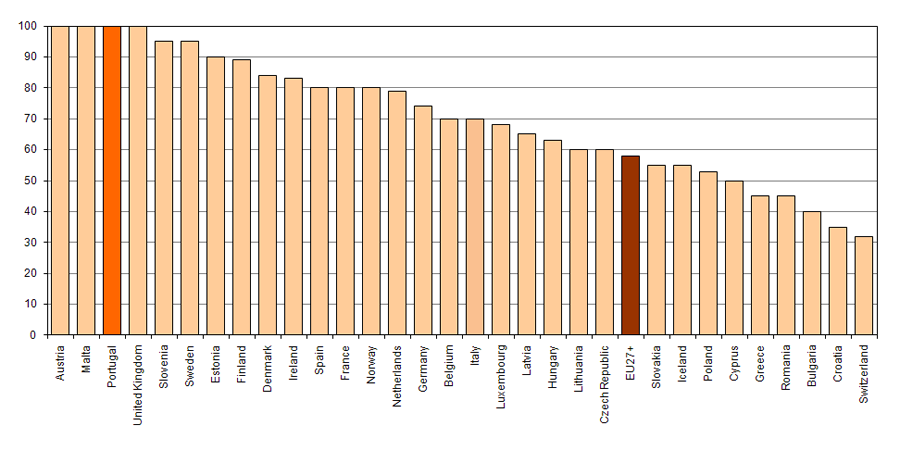
Sophistication of basic public services online
2009, (%)
Alternative access:
click the image below to amplify
N.B.: UE27+ = UE27 + Croatia, Iceland, Norway e Switzerland.
Source: Capgemini Report prepared for the Information Society and Media Directorate-General, European Commission, November 2009.
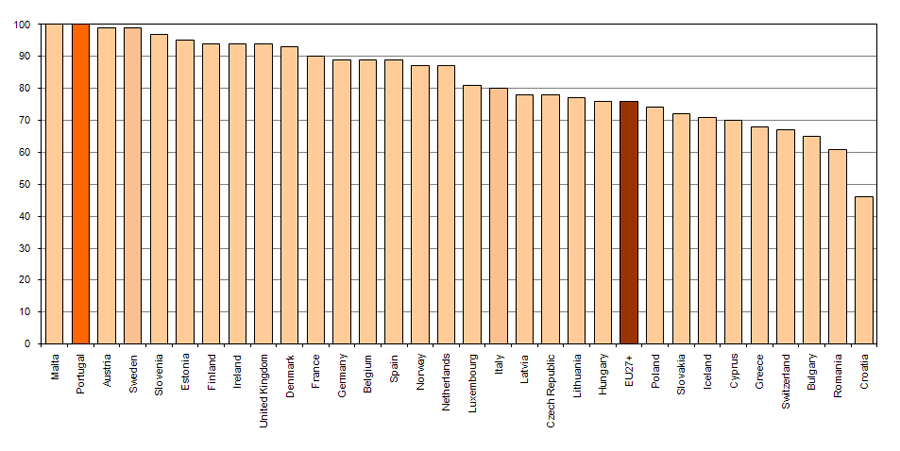
Full availability of basic public services online
2009, (%)
Alternative access:
click the image below to amplify
N.B.: UE27+ = UE27 + Croatia, Iceland, Norway e Switzerland.
Source: Capgemini Report prepared for the Information Society and Media Directorate-General, European Commission, November 2009.
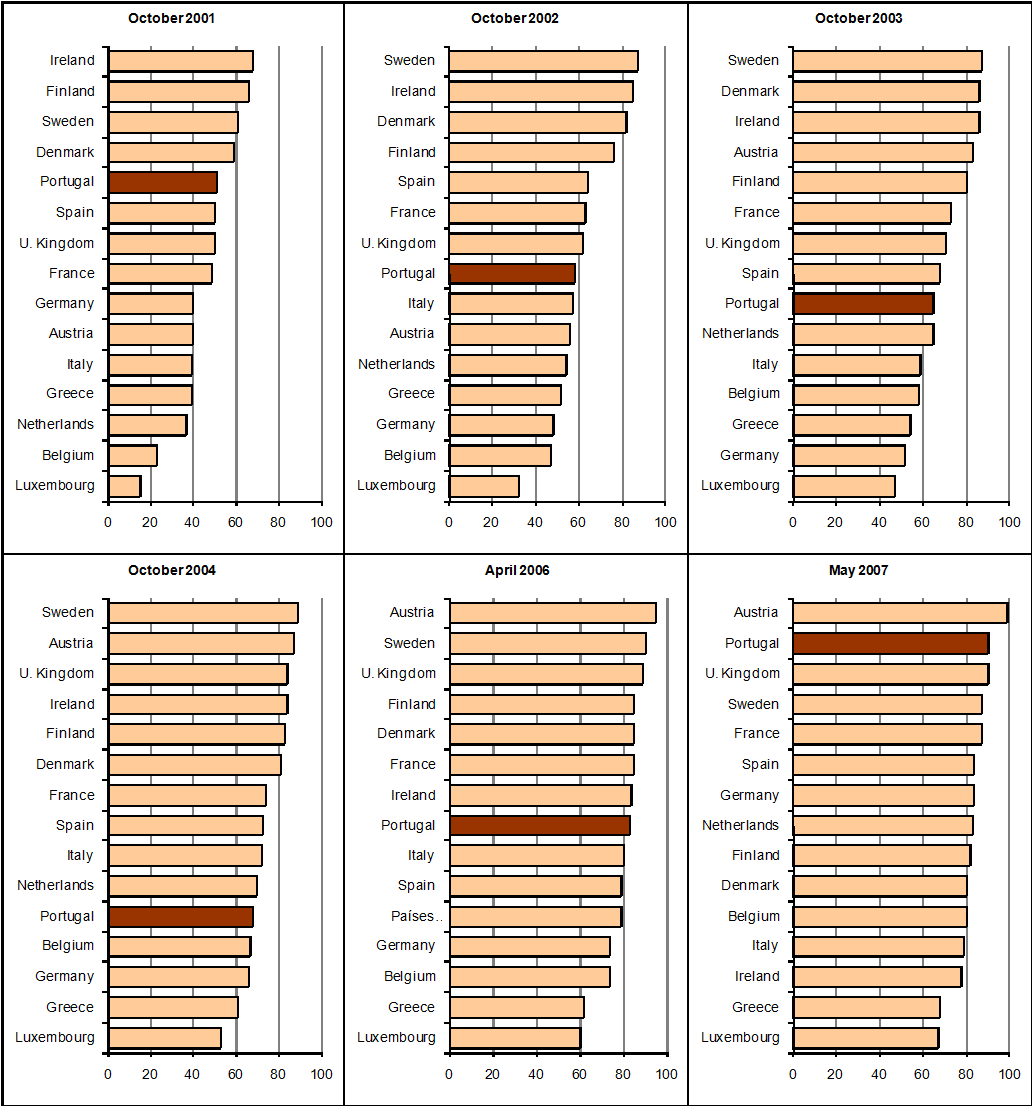
Ranking for Full Online Availability of Basic Public Services in EU15
Months: October 2001, 2002, 2003 and 2004; April 2006 and May 2007, (Score %)
Alternative access:
click the image below to amplify
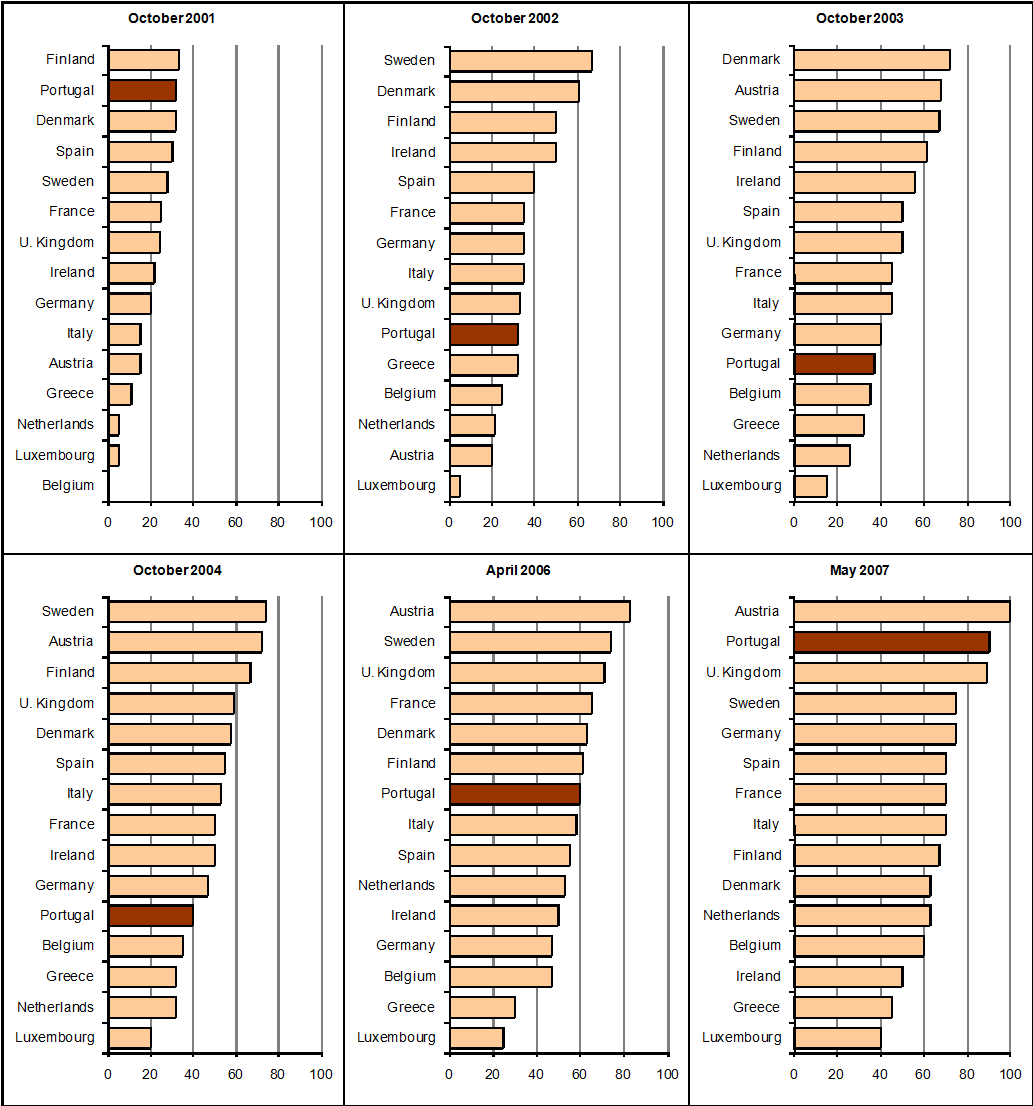
Source: Capgemini Reports prepared for the Information Society and Media Directorate-General.
Ranking for Sophistication of Basic Public Services Available Online in EU15
Months: October 2001, 2002, 2003 and 2004; April 2006 and May 2007, (Score %)
Alternative access:
click the image below to amplify
Source: Capgemini Reports prepared for the Information Society and Media Directorate-General.
Basic Public Services (Full Online Availability, Sophistication)
%, end of each year
Alternative access:
press the image below to amplify
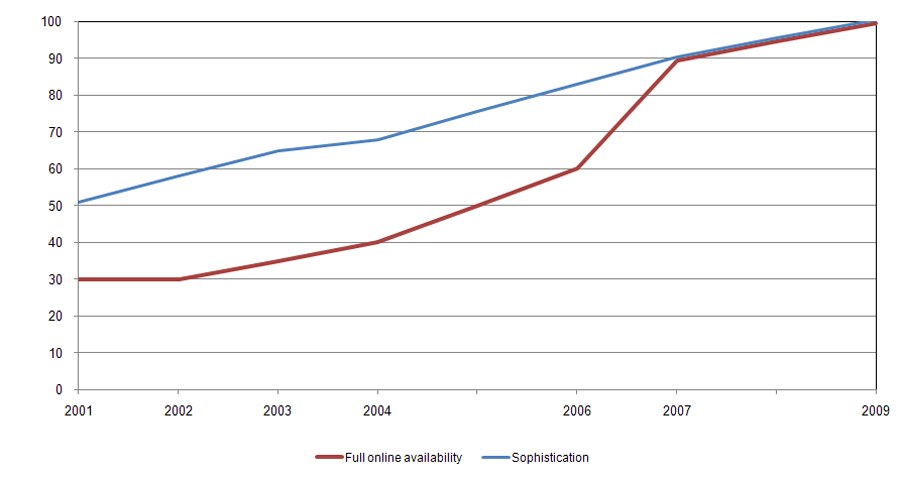
Source: Capgemini report prepared for the Directorate-General for the Information Society and Media of the European Commission.
Central Public Administration bodies with connection to the Internet and broadband
2002 to 2009, (%) Central Public Administration Bodies
Alternative access:
Click on the image below to enlarge this
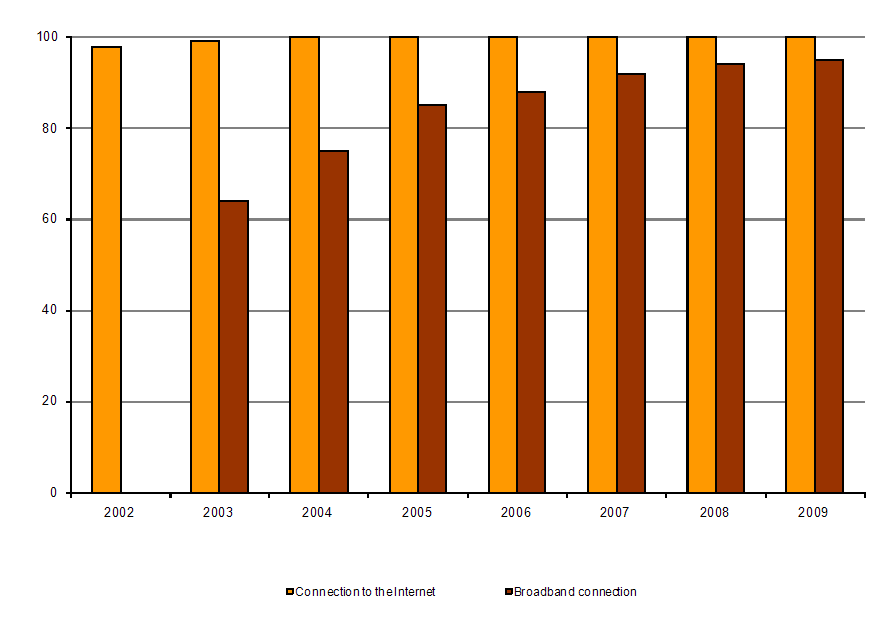
Sources: OCT, Survey on ICT usage in Central Public Administration 2002; UMIC, Informatics Institute of the Ministry of Finance, Survey on ICT usage in Central Public Administration 2003-2004; UMIC, Survey on ICT usage in Central Public Administration 2005-2009.
Number Income Tax (IRS) Declarations Submitted through the Internet
Millions of declarations
Alternative access:
press the image below to amplify
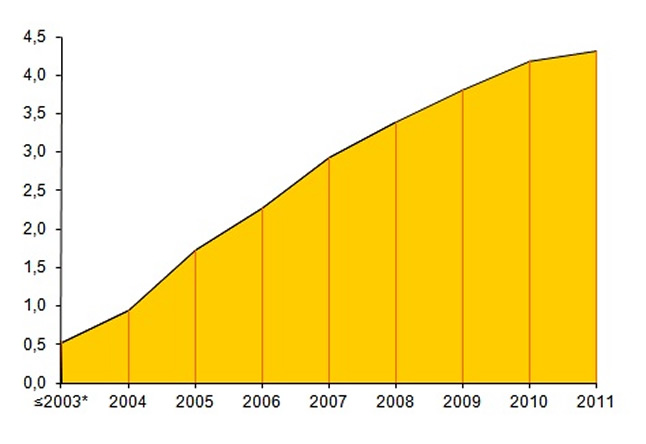
*Accumulated value.
Source: Direcção-Geral de Impostos, Portugal.
Number of Value Added Tax (VAT) Declarations Submitted through the Internet
Millions of declarations
Alternative access:
click the image below to amplify
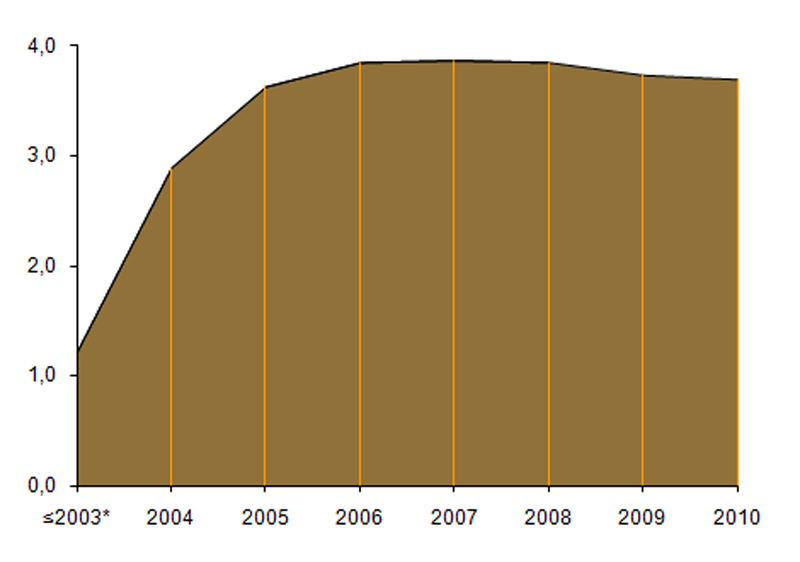
*Accumulated value.
Fonte: Direcção-Geral de Impostos, Portugal.
Total value negotiated within the National eProcurement Programme (PNCE)
2003 to 2006, (millions of Euros)
Alternative access:
Click on the image below to enlarge this
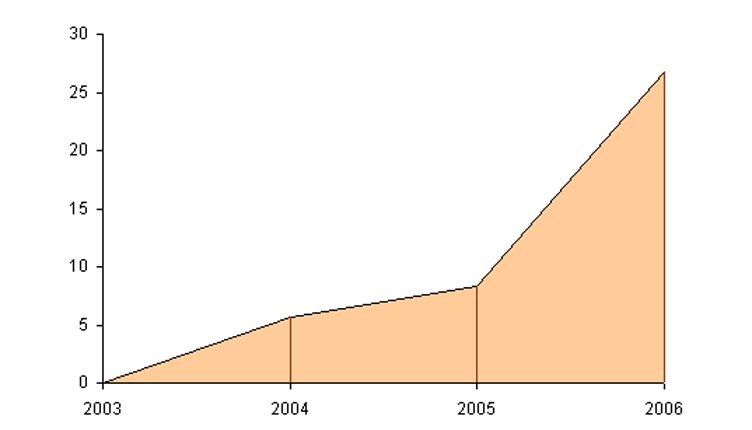
Source: UMIC - Knowledge Society Agency, P.I., July 2006.
Number of public bodies using electronic platforms of the National eProcurement Programme (PNCE)
2003 to 2006, Number of public bodies
Alternative access:
Click on the image below to enlarge this
Source: UMIC - Knowledge Society Agency, P.I.
Processes of aggregation and acquisition carried out under the National eProcurement Programme (PNCE)
2003 to 2006, Number of processes
Alternative access:
Click on the image below to enlarge this
Source: UMIC - Knowledge Society Agency, P.I.
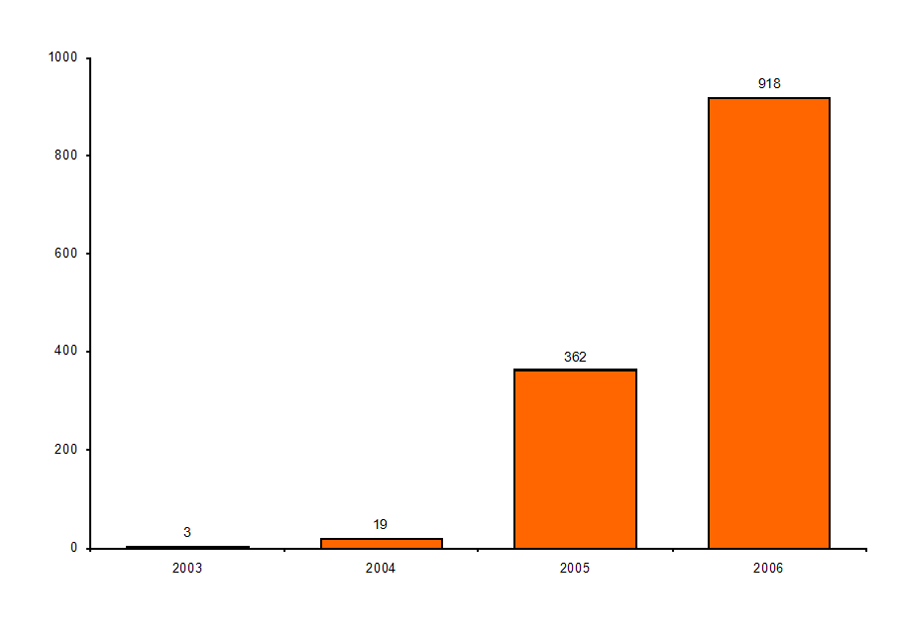
Number of supplier per-registration requests per year within the National eProcurement Programme (PNCE), since its beginning in 2003
2005 to 2007, Number of pre-registrations
Alternative access:
click on the graph below to enlarge this
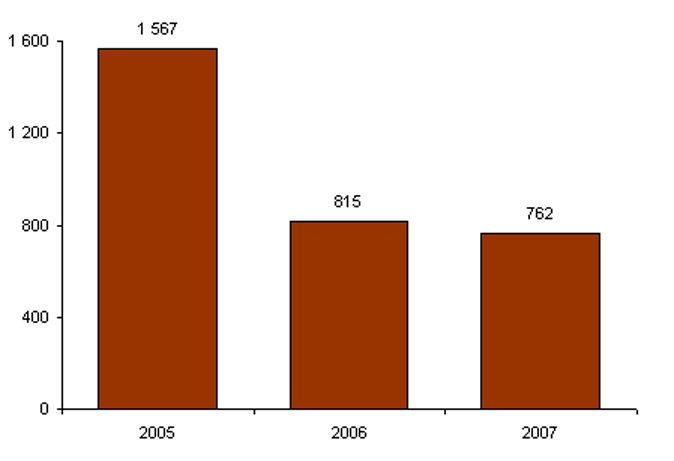
Source: UMIC - Knowledge Society Agency, P.I., July 2006.
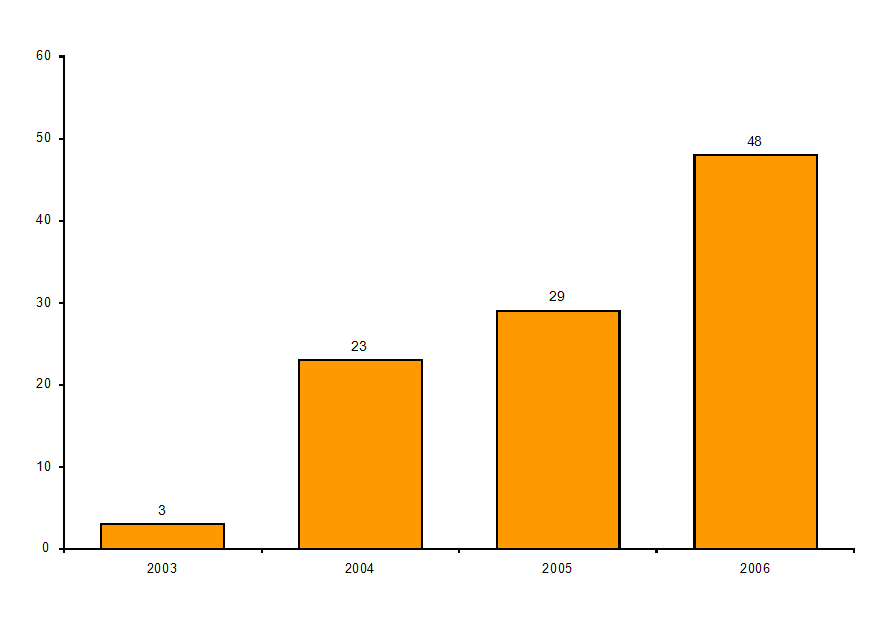
Number of tenders announced in the eProcurement Portal per year (since the beginning of the National eProcurement Program in 2003)
2006 and 2007, Number of invitations to tender
Alternative access:
click on the graph below to enlarge this
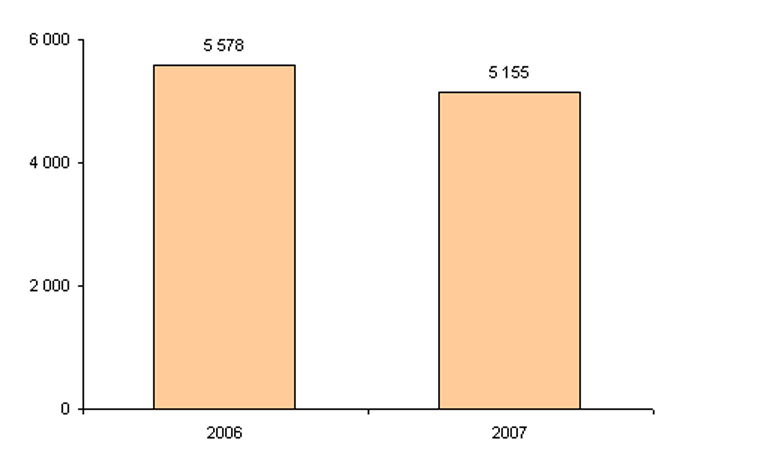
Source: UMIC - Knowledge Society Agency, P.I., July 2006.
SMS Alerts sent per year under the news alert scheme within the National eProcurement Programme since its beginning in 2003
2005 to 2007, Number of alerts
Alternative access:
click on the graph below to enlarge this
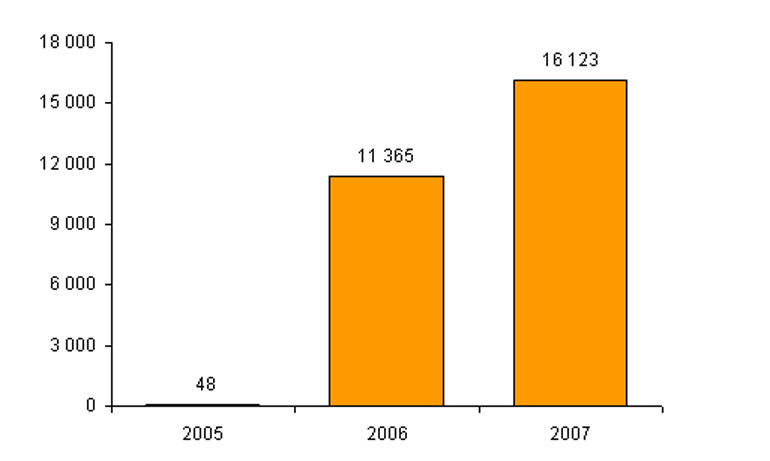
Source: UMIC - Knowledge Society Agency, P.I., July 2006.
Number of monthly sessions of Citizen's Portal users
Months: January 2005, 2006 and 2007, (Thousands of sessions)
Alternative access:
click on the graph below to enlarge this
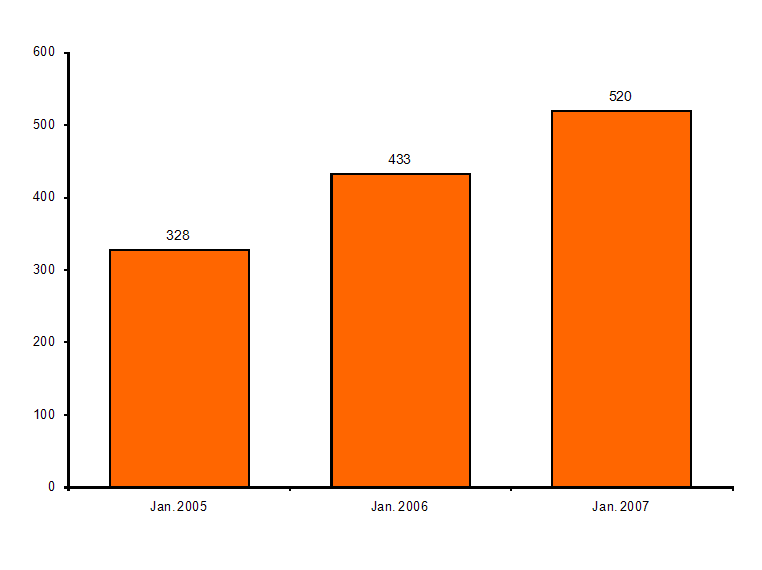
Source: UMIC - Knowledge Society Agency, P.I.
Distribution of the number of certificates obtained through the Citizen's Portal
from abroad by country of connection origin
Requests in January 2007, Number of certificates
Alternative access:
click on the graph below to enlarge this
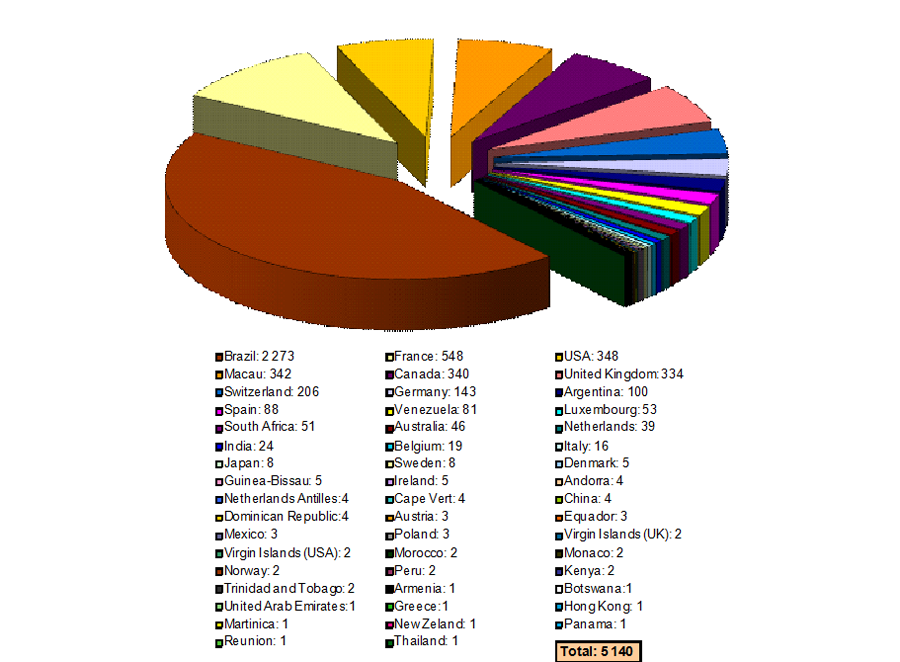
Source: UMIC - Knowledge Society Agency, P.I.