

Graphs and Tables - e-Science
- 22/03/2010International Connectivity of the RCTS - Science Technology and Society Network (1996-2002)
Giga bits per second (Gps), in July of each year
Alternative access: 
click the image below to amplify
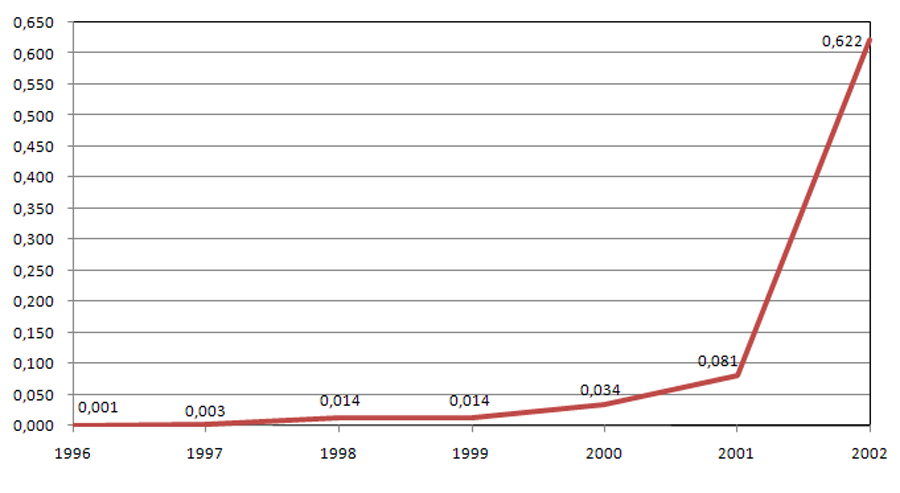
Source: UMIC - Knowledge Society Agency, P.I., based on information from FCCN - Foundation for National Scientific Computation.
International Connectivity of the RCTS - Science Technology and Society Network (2002-2008)
Giga bits per second (Gbit/sec), in July of each year
Alternative access:
click the image below to amplify
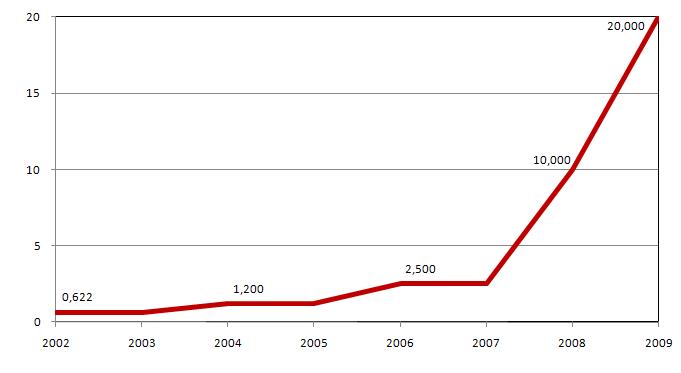
Source: UMIC - Knowledge Society Agency, IP, based on information from FCCN - Foundation for National Scientific Computation.
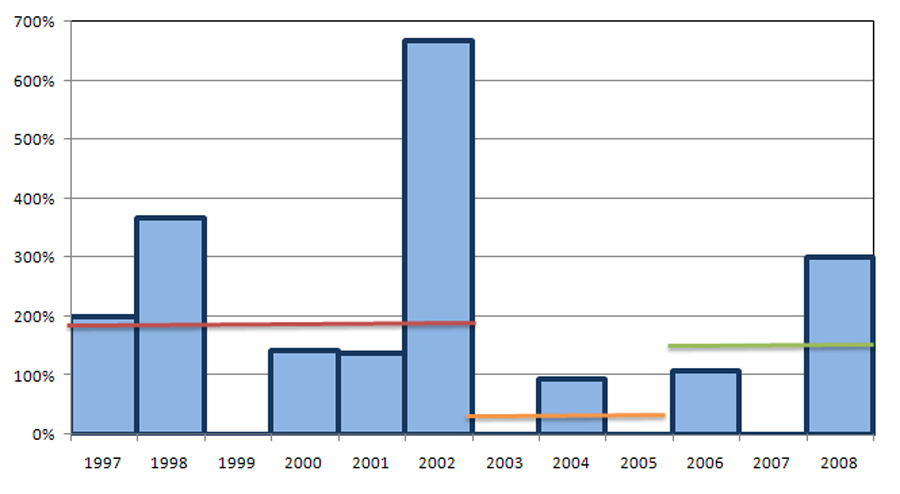
RCTS - Technology and Society Network - annual international connectivity growth (1997-2008)
In July of each year
Annual average 1997-1002 = 192% | Annual average 2002-2005 = 24% |Annual average 2006-2008 = 152%
Alternative access:
click on the image below to amplify
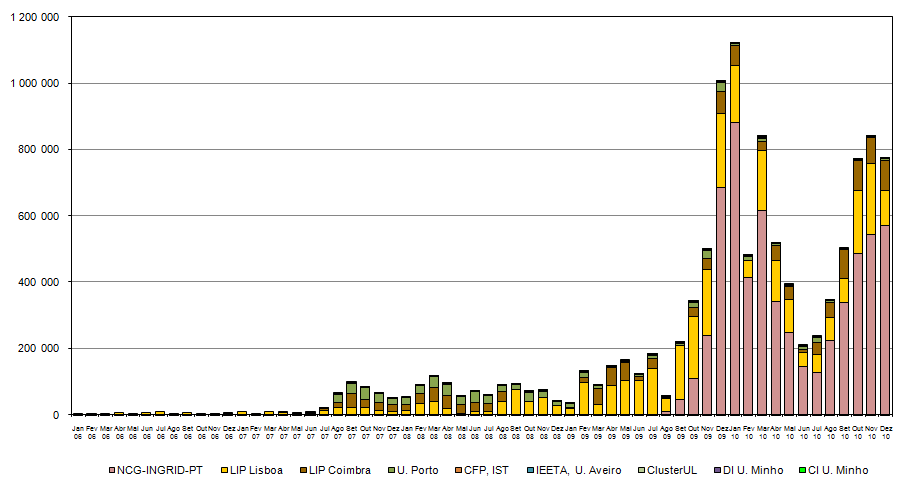
Jobs of GRID Computing performed in Portugal sites within the project EGEE - Enabling Grids for E-sciencE in Europe / EGI - European Grid Infrastructure
Number of Jobs.
Alternative access:
press the image below to enlarge this
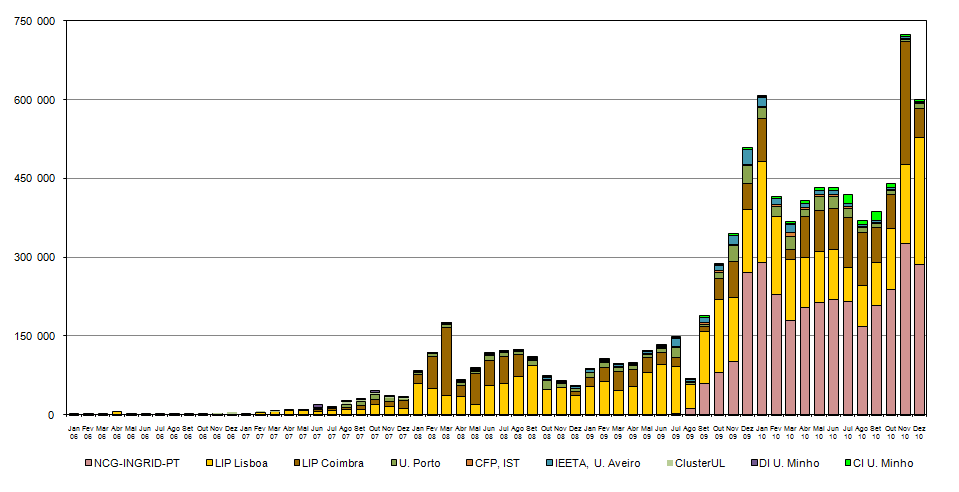
Source: EGEE Accounting Portal.
CPU Time of Grid Computing performed in Portugal sites within the project EGEE - Enabling Grids for E-sciencE in Europe / EGI - European Grid INfrastructure
CPU time.
Alternative access:
press the image below to enlarge this
Source: EGEE Accounting Portal.
Documents in Scientific Open Access Repositories in Portugal
No. of documents at the end of each year
Alternative access:
click the image below to amplify
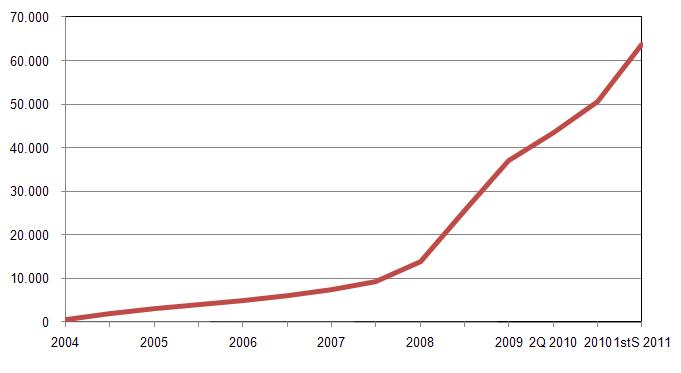
Source: Knowledge Society Agency (UMIC).
Institutional Repositories in the Open Access Scientific Repository of Portugal
Number of institutional repositories at the end of each year
Alternative access:
click the image below to amplify
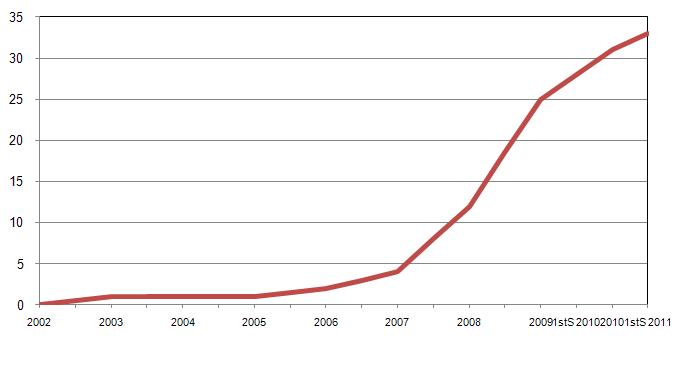
Source: Knowledge Society Agency (UMIC).
Distribution of access to the Linguateca website (http://www.linguateca.pt/) by geographical origin
Accumulated hits from July 1998 to November 2008 from top regional domain address 2008
Total number of regional domain hits = 1.592.071, Total number of hits = 8.546.599
Alternative access:
click the image below to amplify
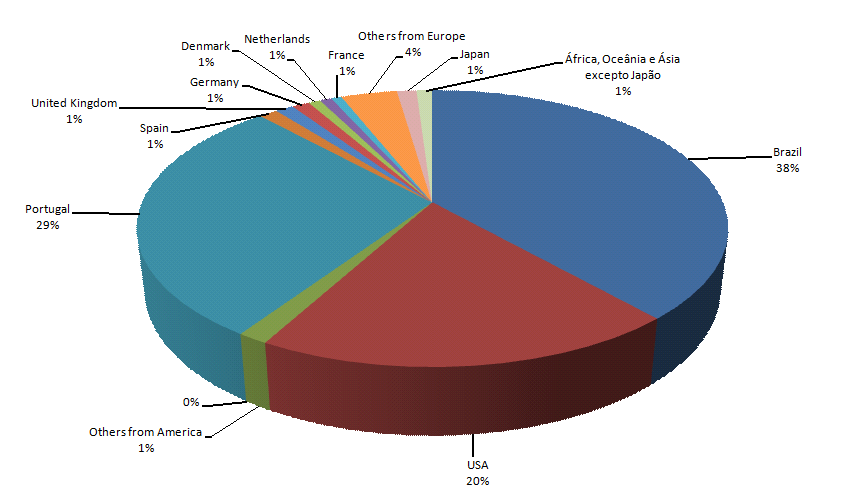
Source: Linguateca.