

Graphs and Tables - Observation and Benchmarking
- 13/11/2008Internet Penetration in the Population Total and Broadband: total, cable+optical fibre+mobile(active users), optical fibre+mobile (active users), mobile (active users)
%, Customers in the total population, in each semester
Alternative access: 
click the image below to amplify
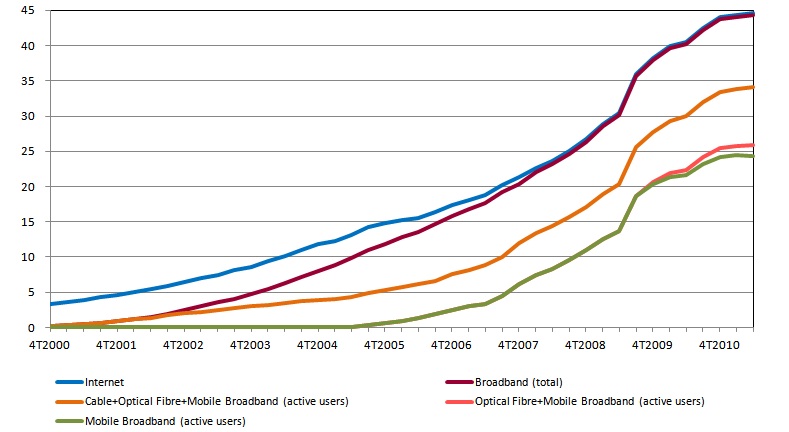
Notes: Blank entries have values calculated by linear interpolation for graphical representation purposes.
Active mobile broadband users refers to customers who can access to mobile broadband Internet
and actually connected to the Internet at least once in the preceding month.
Source: ANACOM.
Broadband Penetration in the Population ≥ 10 Mbps in EU Member States
1st January 2011, (%)
Alternative access:
click the image below to amplify
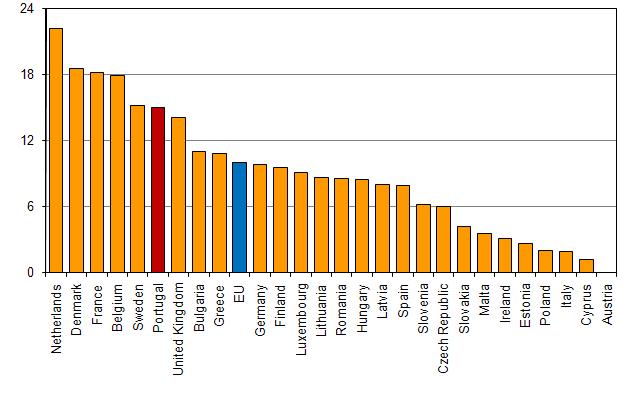
Note: Data for Austria is of 1 July 2009 (latest available data).
Source: COCOM, DG INFSO, European Commission, June 2011.
Mobile Broadband Penetration in the Population in EU member states - Dedicated data service (cards, modems, keys only)
1st January 2011, (%)
Alternative access:
click the image below to amplify
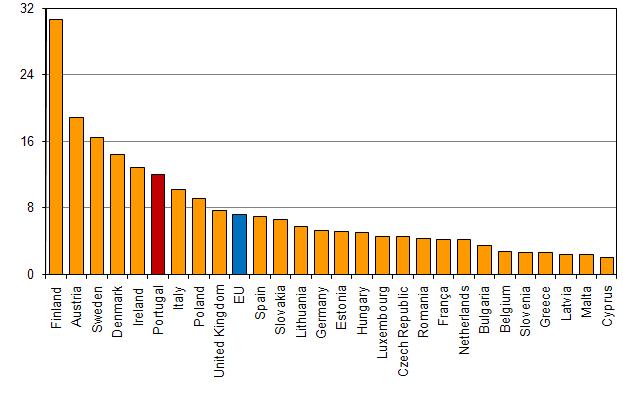
Source: COCOM, DG INFSO, European Commission, June 2011.
Active Mobile Broadband Penetration in the Population in EU Member States
1st January 2011, (%), Number of customers (residential and nonresidential) who actually used mobile broadband in the past month per 100 inhabitants
Alternative access:
click the image below to amplify
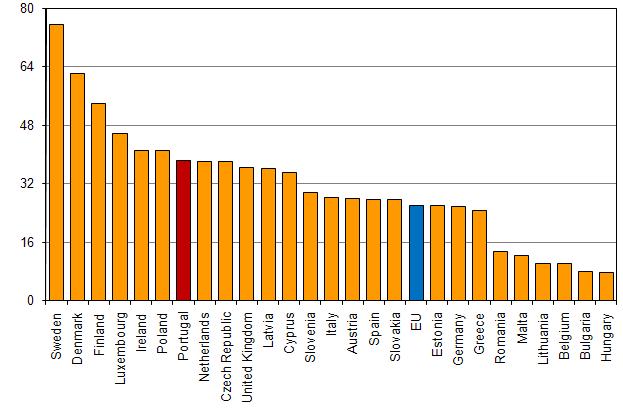
Note: No data available for France.
Source: COCOM, DG INFSO, European Commission, June 2011.
Internet Penetration in the Households (Total and Broadband)
%, Households with at least one person aged from 16 to 74.
Alternative access:
click the image below to amplify
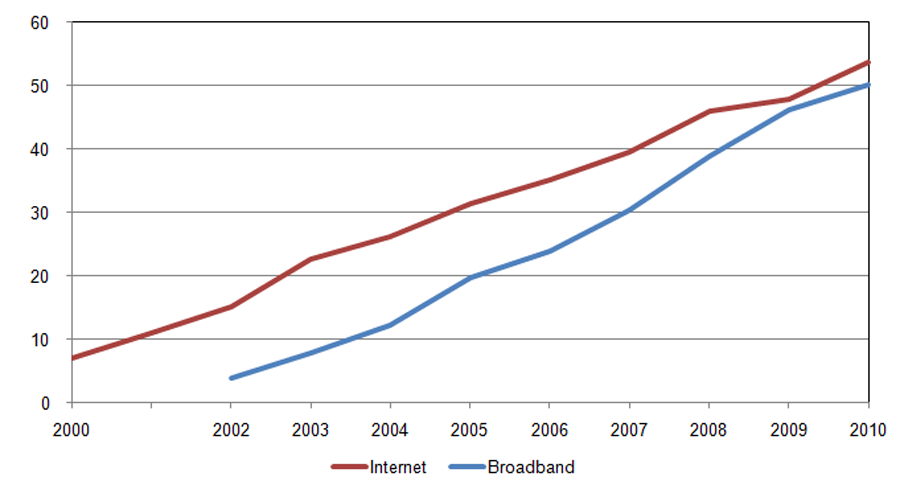
Source: EUROSTAT.
Computer Penetration in the Households (All and Laptops)
%, Households with at least one person aged from 16 to 74 (1st quarter of each year).
Alternative access:
click the image below to amplify
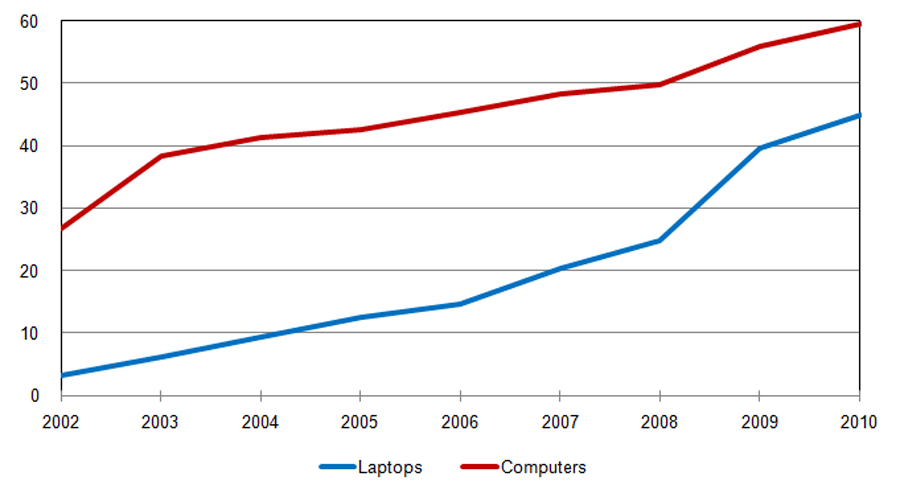
Source: EUROSTAT.
Acute Hospitals eHealth Profile
2010, (%)
Alternative access:
click the image below to amplify
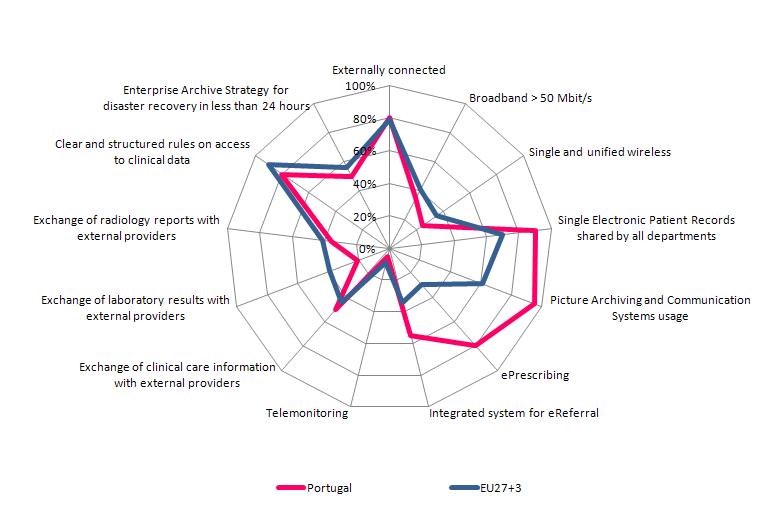
Note: EU27+3 refers to the EU27 Member States together with Croatia, Iceland and Norway.
Source: eHealth Benchmarking III, Commissioned to Deloitte by DGINFSO, European Commission.
Internet users by complete education level in the EU Member States
2010, (%) People from 16 to 74 years old.
Alternative access:
click the image below to amplify
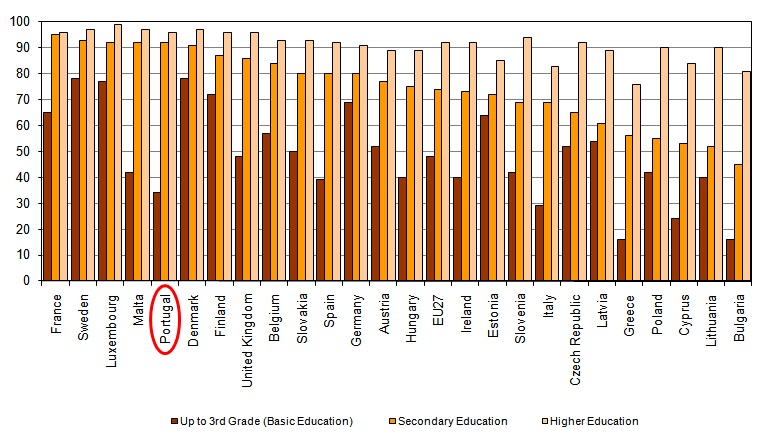
Note: Data refer to 1st quarter of each year.
Source: EUROSTAT.
Internet users by main occupation among EU Member States
2010, (%) People from 16 to 74 years old
Alternative access:
click the image below to amplify
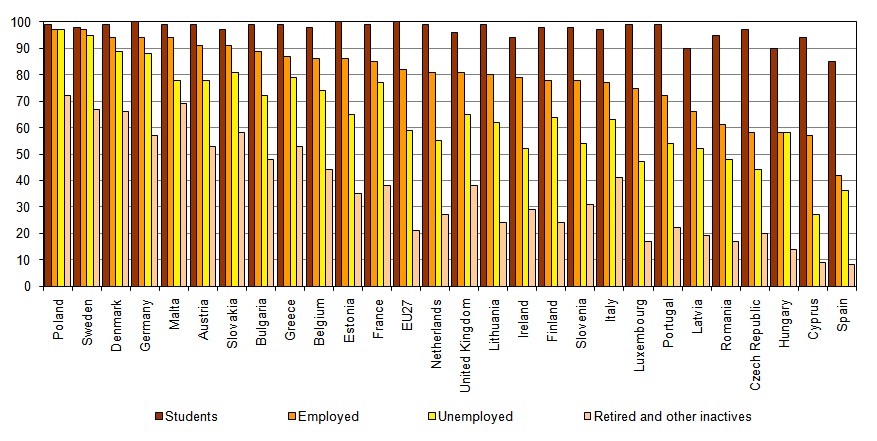
Note: Data references 1st quarter of the year.
Source: EUROSTAT.
Internet users, by age and complete education level
(%) Total population in each group
Alternative access:
click the image below to amplify
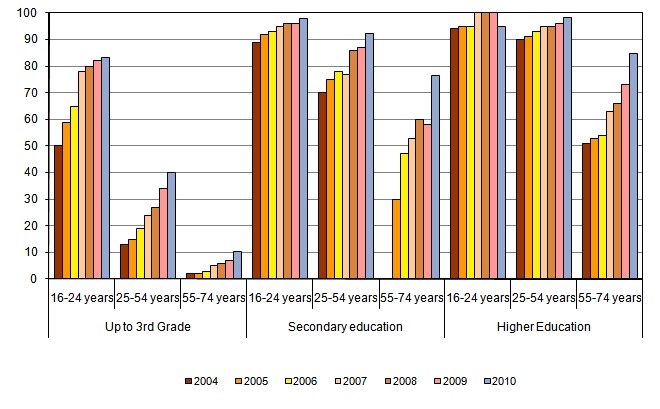
Note: Data refer to 1st quarter of each year.
Source: EUROSTAT.
Internet users, by age and educational attainment, in Portugal and EU27, on 2006 and 2010
(%) Total population in each group
Alternative access:
click the image below to amplify
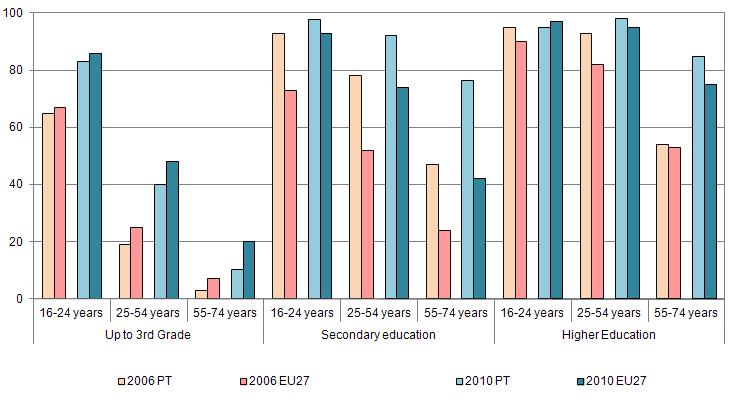
Note: Data relative to the 1st quarter of each year.
Source: EUROSTAT.
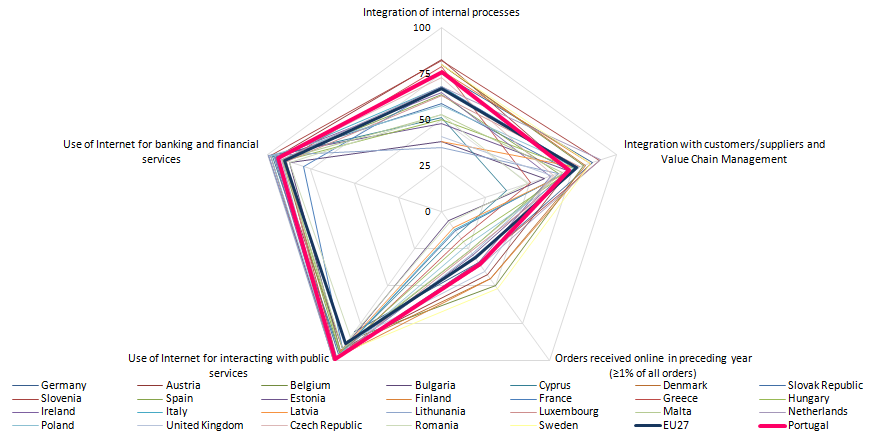
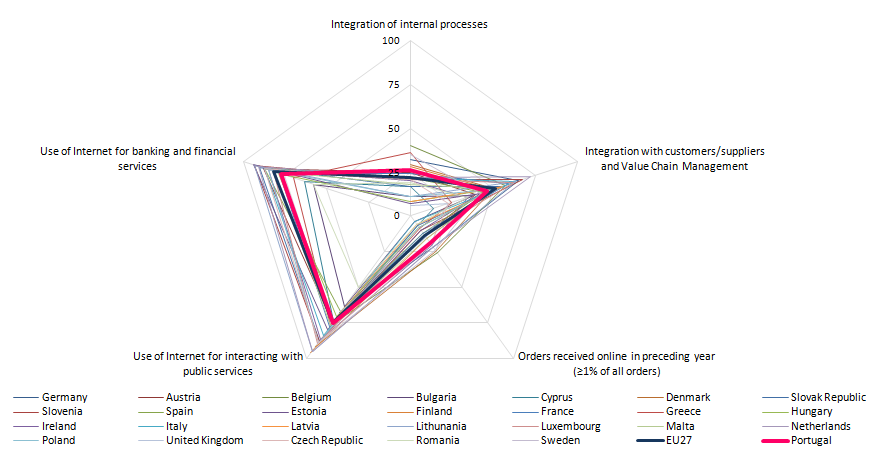
eBusiness in Large Enterprises of EU Member States
(without financial sector)
2010, 1st quarter (%)
Alternative access:
click the image below to amplify
eBusiness in all enterprises of EU Member States
(SMEs and Large Enterprises, without financial sector)
2010, 1st quarter (%)
Alternative access:
click the image below to amplify
Enterprises receiving orders online
% enterprises
Alternative access:
click the image below to amplify
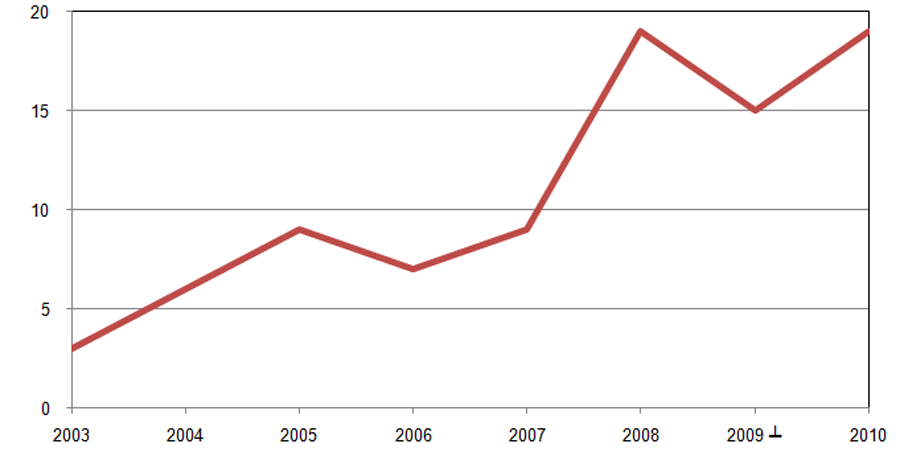
┴ Break of series from 2008 to 2009, following and harmonization in the EU, which included the enlargement of the economic actiities previously
considered in the survey, namely by encluding "restauration" and "electricity, gas and vapor, water supply, sewage, residue management",
among others.
Source: Knowledge Society Agency (UMIC).
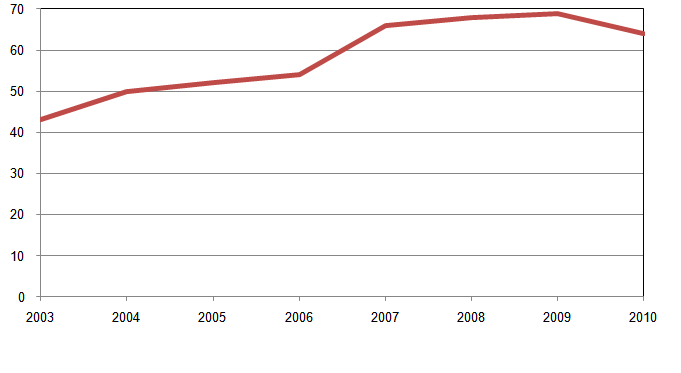
Enterprises filling in and sending electronic forms to the Public Administration through the Internet
% enterprises
Alternative access:
click the image below to amplify
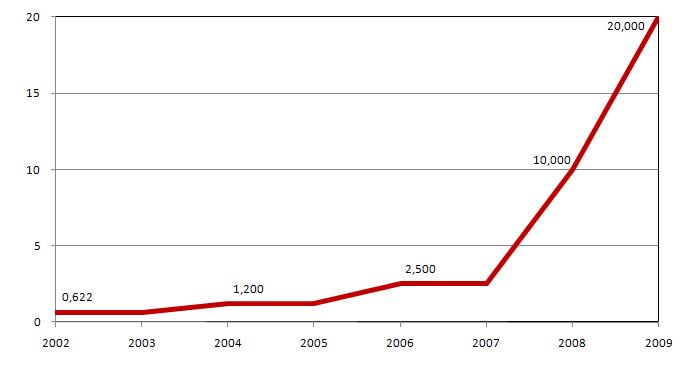
International Connectivity of the RCTS - Science Technology and Society Network (1996-2002)
Giga bits per second (Gps), in July of each year
Alternative access:
click the image below to amplify
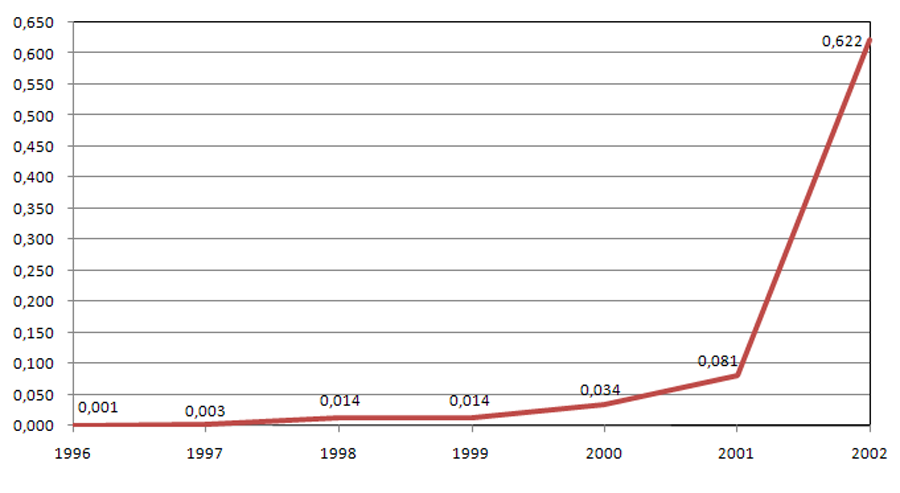
Source: UMIC - Knowledge Society Agency, P.I., based on information from FCCN - Foundation for National Scientific Computation.
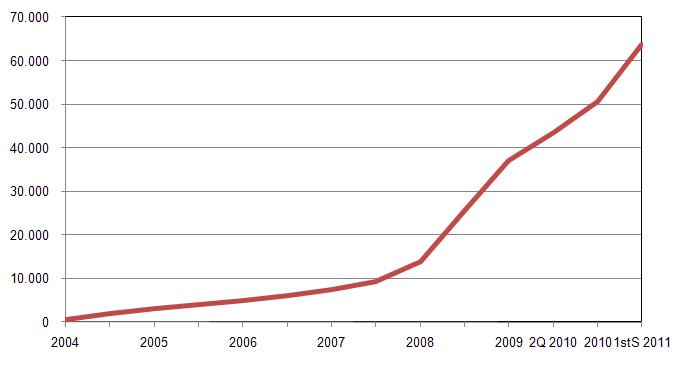
International Connectivity of the RCTS - Science Technology and Society Network (2002-2008)
Giga bits per second (Gps), in July of each year
Alternative access:
click the image below to amplify
Source: UMIC - Knowledge Society Agency, IP, based on information from FCCN - Foundation for National Scientific Computation.
Documents in Scientific Open Access Repositories in Portugal
No. of documents at the end of each year
Alternative access:
click the image below to amplify
Source: Knowledge Society Agency (UMIC).
Institutional Repositories in the Open Access Scientific Repository of Portugal
Number of institutional repositories at the end of each year
Alternative access:
click the image below to amplify
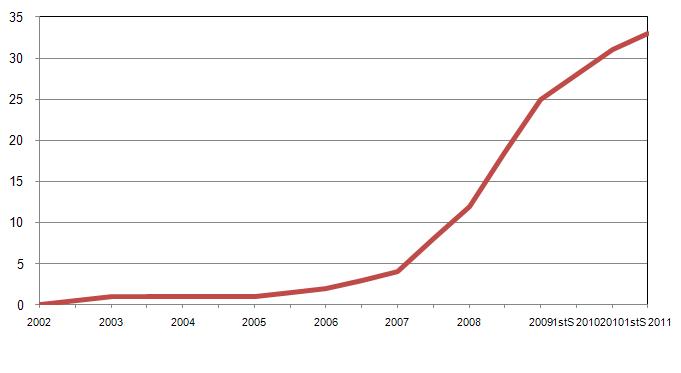
Source: Knowledge Society Agency, (UMIC).
Schools connected to the Internet via Science Technology and Society Network
% of schools by the end of the scholar year indicated, ISDN and broadband connections, 1997/98-2007/08.
Alternative access:
click the image below to amplify
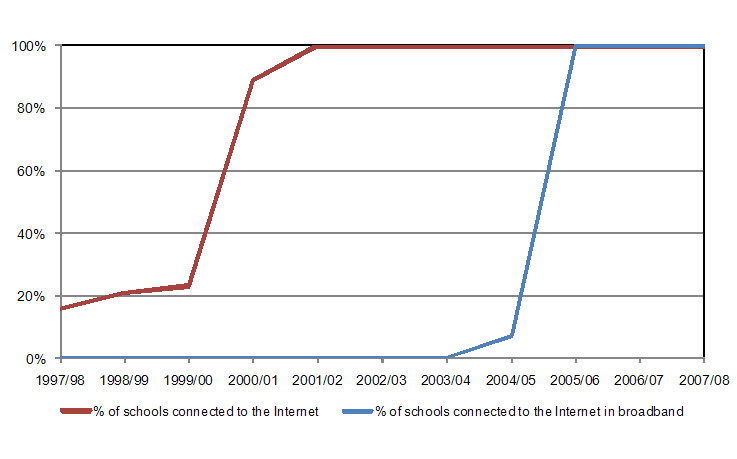
Source: GEPE - Office for Education Statistics and Planning, FCCN - Foundation for National Scientific Computation.
No. of Students per Computer in Elementary and Secondary Education (Total, w/ Internet connection)
No. in the academic year beginning in the indicated year.
Alternative access:
click the image below to amplify
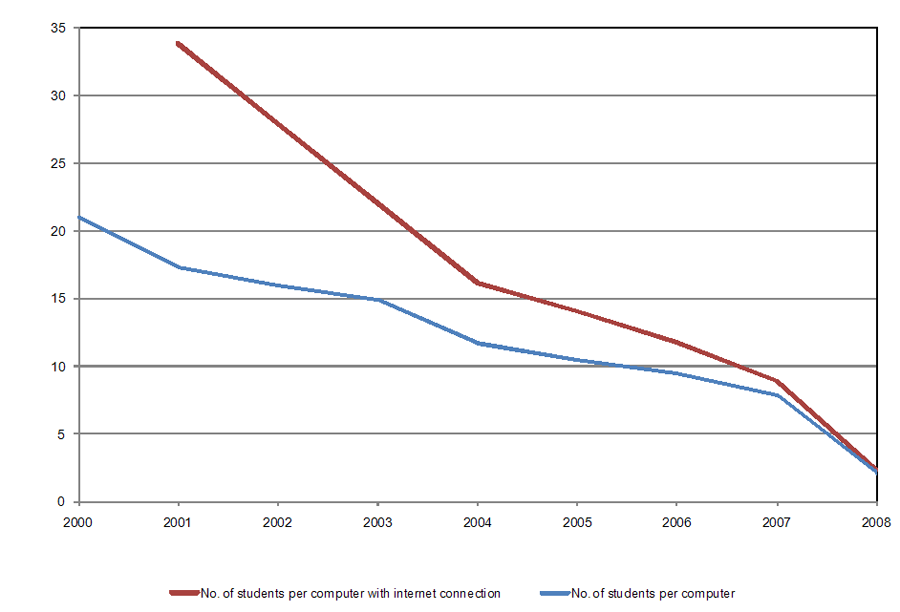
Source: GEPE - Office for Education Statistics and Planning.
Basic Public Services (Full Online Availability, Sophistication)
%, end of each year
Alternative access:
press the image below to amplify
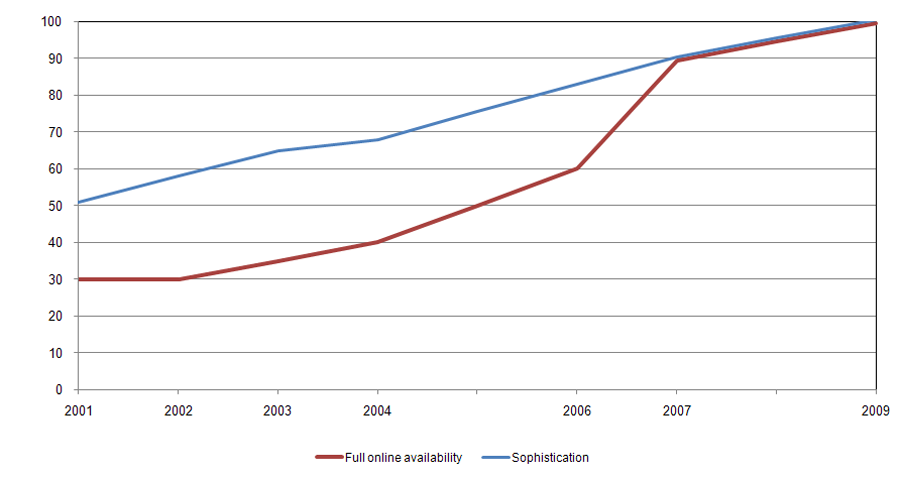
Source: Capgemini report prepared for the Directorate-General for the Information Society and Media of the European Commission.
User Experience of e-Government Services Delivery
2010, (%)
Alternative access:
click the image below to amplify
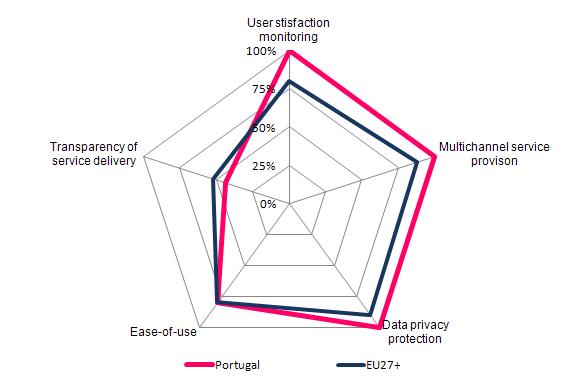
Fonte: eGov Benchmarking Report 2010, DGINFSO, EC
User Experience of e-Government Portals
2010, (%)
Alternative access:
click the image below to amplify
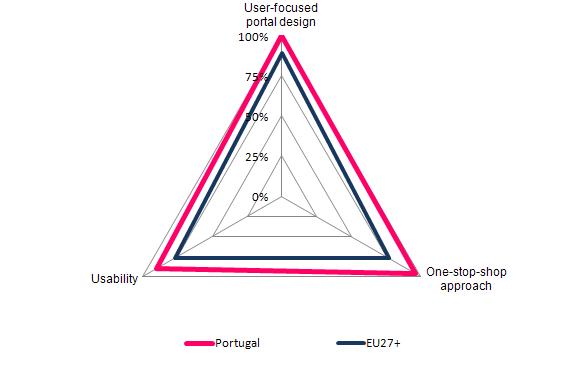
Fonte: eGov Benchmarking Report 2010, DGINFSO, EC
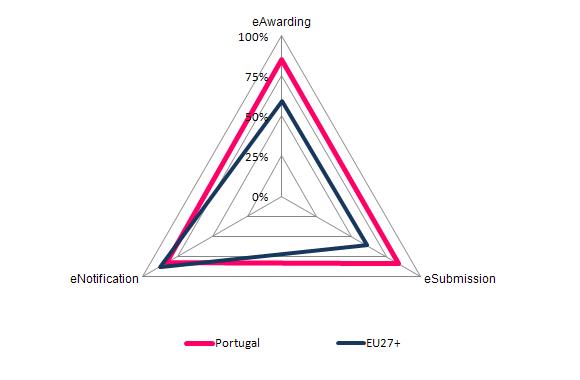
e-Procurement Pre-Award Process
2010, (%)
Alternative access:
click the image below to amplify
Fonte: eGov Benchmarking Report 2010, DGINFSO, EC
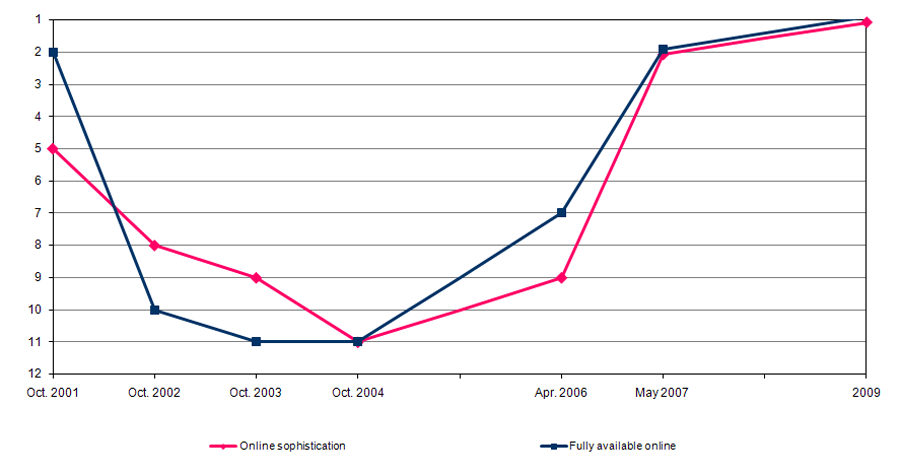
Progress of Portugal position in the Rankings of online Public Services availability among EU15 countries
2001 to 2009, Ranking.
Alternative access:
click the image below to amplify
Source: Capgemini Reports prepared for the Information Society and Media Directorate-General, European Commission.
Number Income Tax (IRS) Declarations Submitted through the Internet
Millions of declarations
Alternative access:
press the image below to amplify
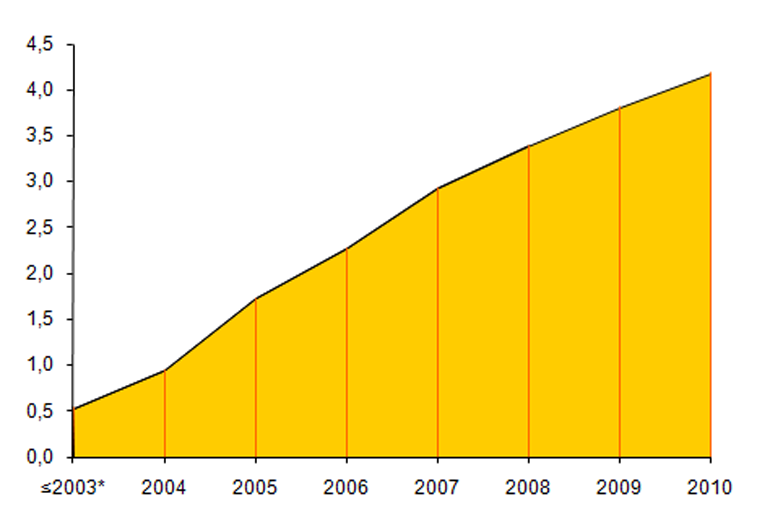
*Accumulated value.
Source: Direcção-Geral de Impostos, Portugal.
Number of Value Added Tax (VAT) Declarations Submitted through the Internet
Millions of declarations
Alternative access:
click the image below to amplify
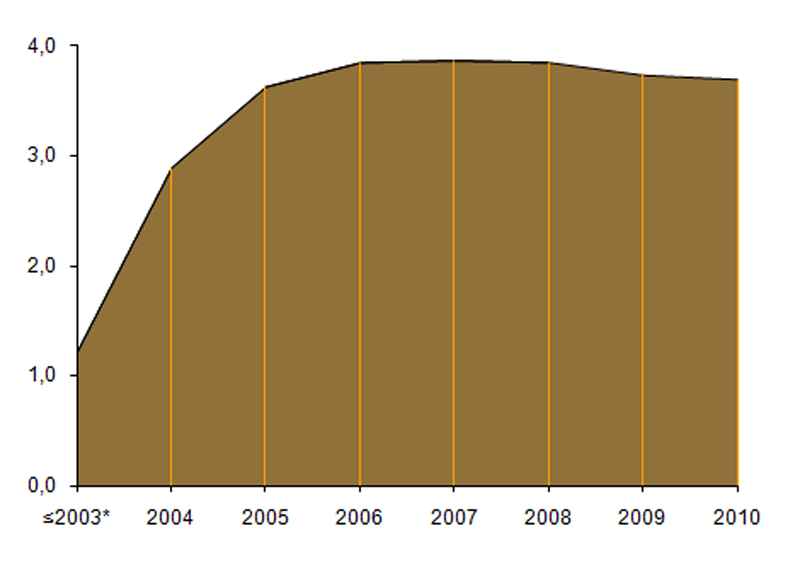
*Accumulated value.
Fonte: Direcção-Geral de Impostos, Portugal.