

Graphs and Tables - Knowledge
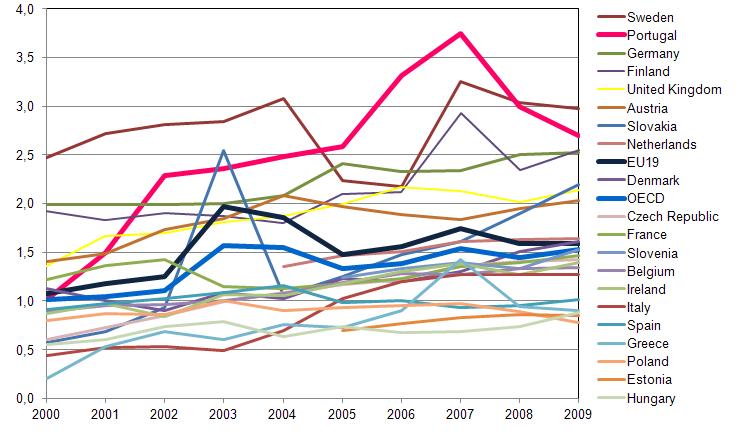
- 13/11/2008Evolution of the percentage of R&D expense in GDP for EU Member States with values between 0.5% and 2%
%
Alternative access: 
click the image below to amplify
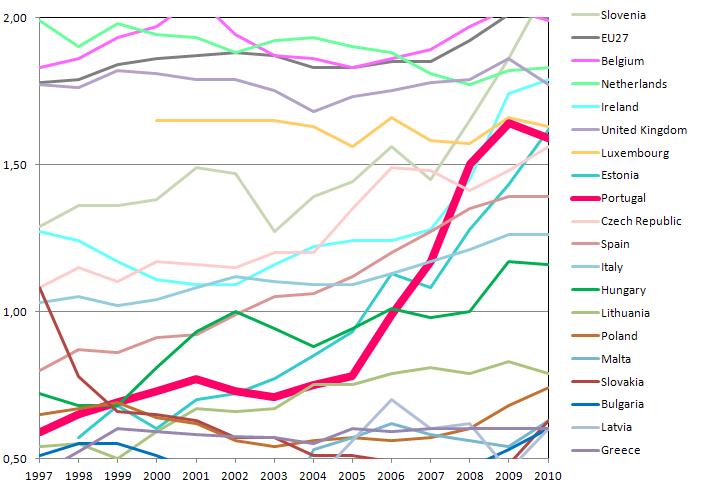
Source: EUROSTAT, Dec. 2010.
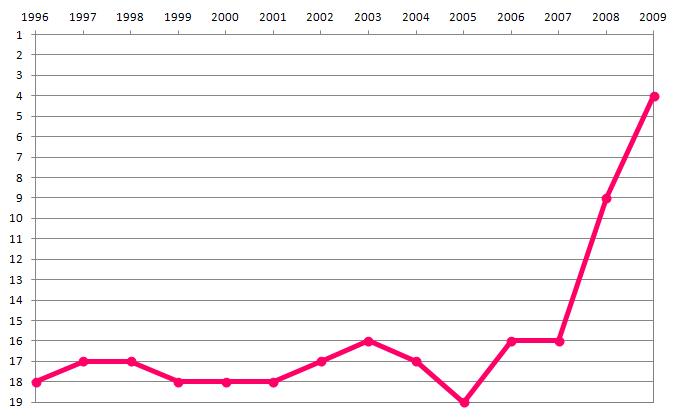
Evolution of the rank of Portugal in percentage of R&D expense in GDP within EU27
Rank within EU Member States
Alternative access:
click the image below to amplify
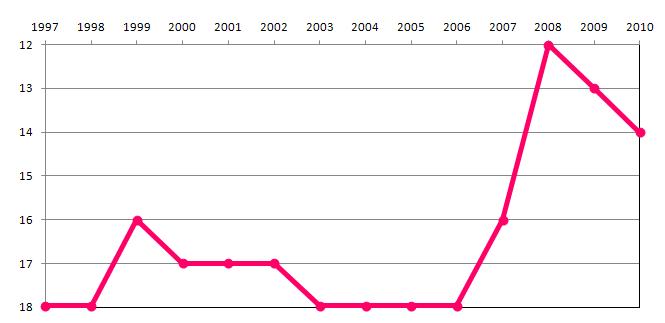
Source: EUROSTAT, Dec. 2010.
Budget allocations for the main public institutions providing competitive funding for grants, projects, R&D institutions and infrastructures - JNICT/FCT + IICT/GRICES + UMIC (I&D) + UMIC (I&D)
(National and Community funds)
Million Euros, constant prices 2011
Alternative access:
click the image below to amplify
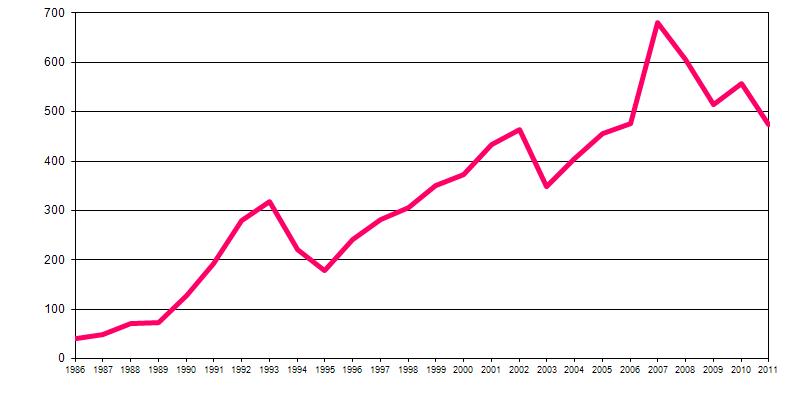
Note: Budget allocations for the JNICT until 1997, the FCT from 1997 to 2008, plus ICCTI budgetary allocations from 1998 to 2002 and from GRICES from 2003 to 2007 (international S&T cooperation responsibilities moved from the JNICT to ICCTI in 1997, then to GRICES in 2003 and to the FCT in 2007), and also the POSI/POSC and UMIC R&D budget allocations.
It was used the GNP deflactor of OECD.
Source: OCT/OCES/GPEARI MCTES - Statistics
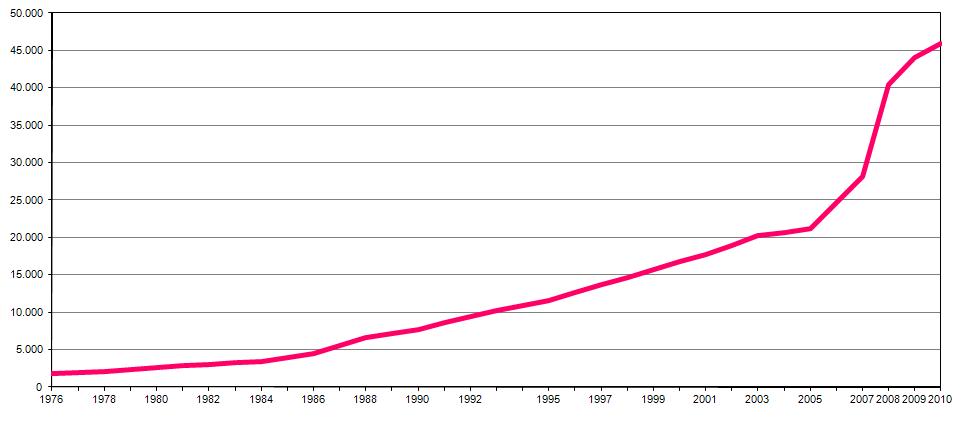
Total R&D Public Budget
(National and Community funds)
Million Euros, constant prices of 2011
Alternative access:
click the image below to amplify
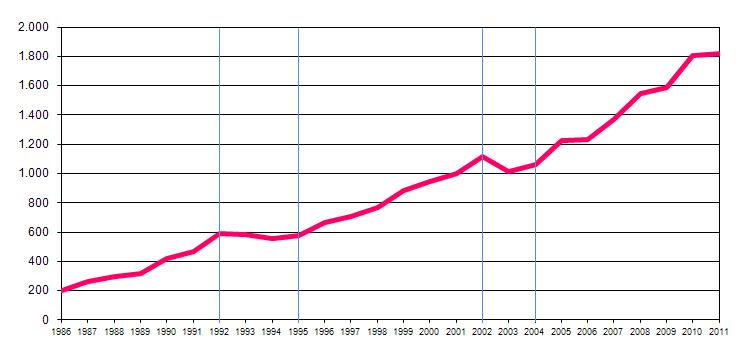
Source: OCT/OCES/GPEARI MCTES - Statistics.
Percentage of Public R&D Budget in Total Public Budget
(National and Community Funds),
%
Alternative access:
click the image below to amplify
Source: OCT/OCES/GPEARI MCTES - Statistics, DGO.
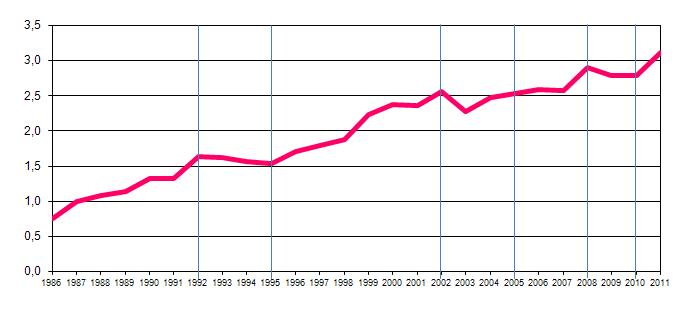
Percentage of Total R&D Spending in GDP of Portugal
%
Alternative access:
click the image below to amplify
Source: OCDE.
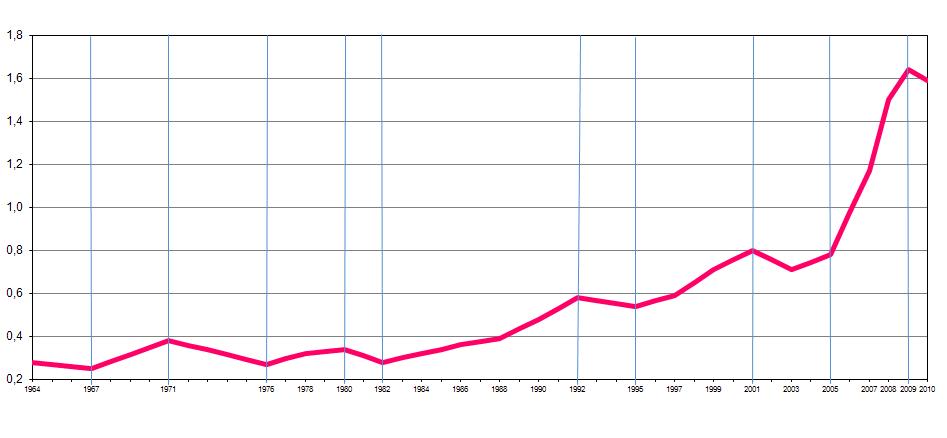
Percentage of R&D Spending in Enterprises in the GDP, in Portugal
%
Alternative access:
click the image below to amplify
Source: OCDE.
Evolution of the number of FTE researchers per thousand population for EU Member States with values between 1 and 10
Alternative access:
click the image below to amplify
Notes: Value of France for 2009 is that of 2008 and values of Greece for 2008 and 2009 are taken equal to that of 2007, in both cases the last available data.
For graphical purposes intermediate values between given data are interpolated linearly.
Source: OECD, Main Science and Technology Indicators, February 2011.
Evolution of the rank of Portugal in number of FTE researchers per thousand active population within EU27
Alternative access:
click the image below to amplify
Source: OECD, Main Science and Technology Indicators, February 2011.
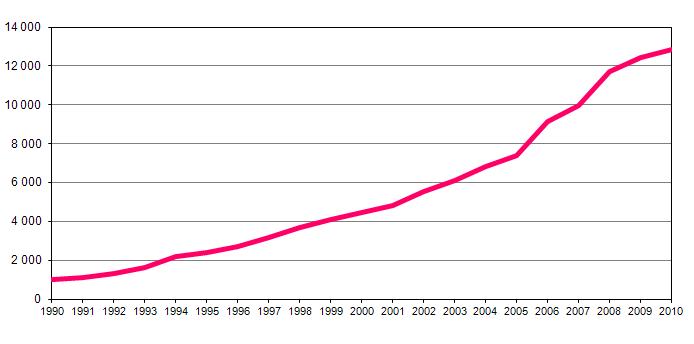
Number of Researchers (FTE) in Portugal
Number of researchers (FTE)
Alternative Access:
click the image below to amplify
Note: Values where linearly interpolated for graphical purposes when needed.
In 2008 the survey method was changed in order to include also higher education researchers who were not integrated in R&D units evaluated and funded by the FCT.
Source: OCDE.
Number of scientific publications by year of authorship or co-authorship of portuguese researchers (considered in the InCitesTM, Thomson Reuters (2010))
Number of publications
Alternative access:
click the image below to amplify
Notes:
1) Data computed by the fractional method with basis on the "InCitesTM, Thomson Reuters (2010)";
2) The values for 2010 are considered provisional.
Source: GPEARI - Planning, Strategy, Evaluation and International Relations Office / Ministry of Science, Technology and Higher Education.
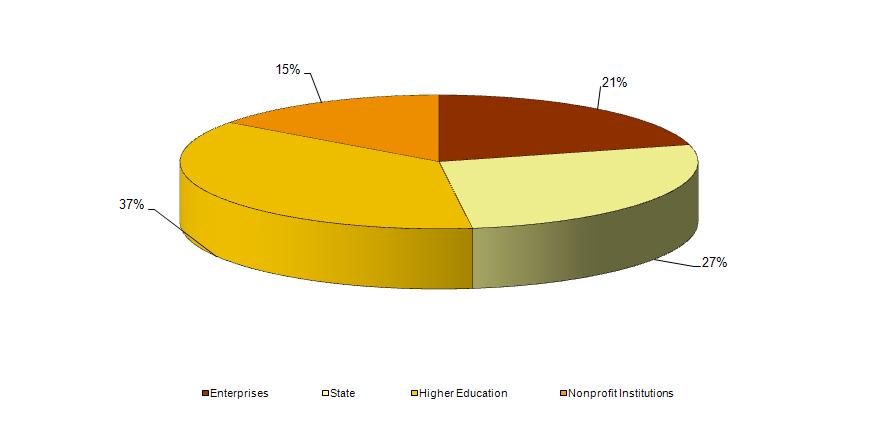
Share of R&D spending by sector in 2010
2010, (%).
Alternative access:
click the image below to amplify
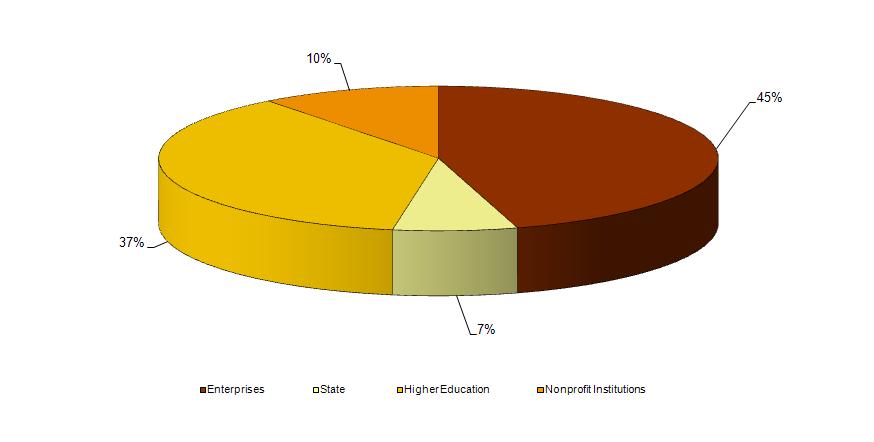
Fonte: OCT/OCES/GPEARI - Statistics.
Share of R&D spending by implementing sector in 1995
1995, (%).
Alternative access:
click the image below to amplify
Source: OCT/OCES/GPEARI MCTES - Statistics.
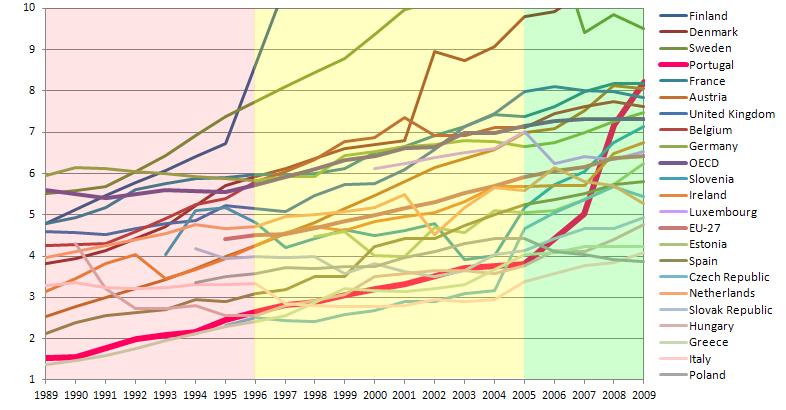
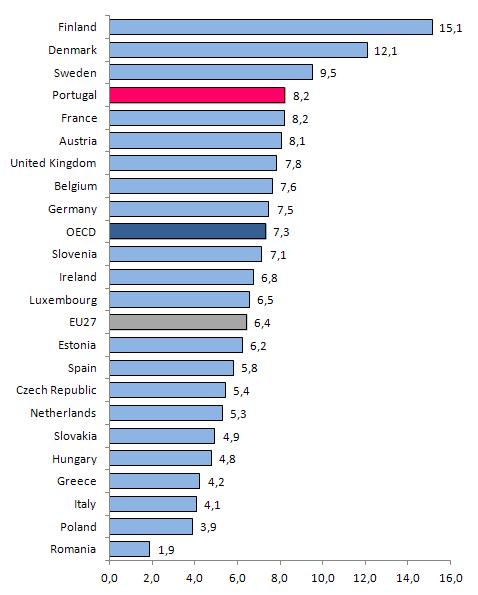
Percentage of total R&D spending in GDP
2009, (%)
Alternative access:
click the image below to amplify
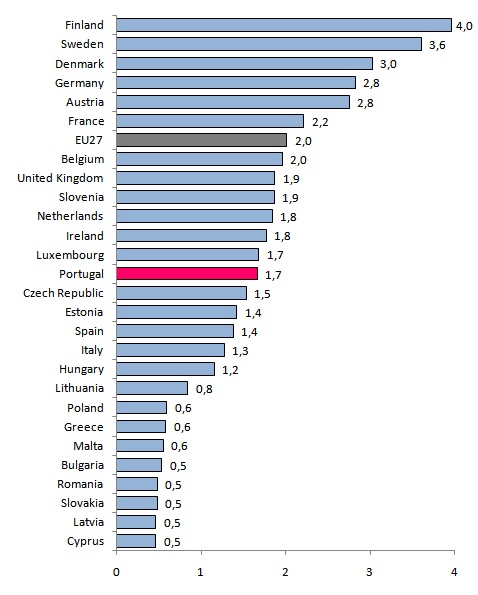
N.B.: Data used for Greece in 2009 are those of 2007, the most recent available.
Source: EUROSTAT, Dec. 2010.
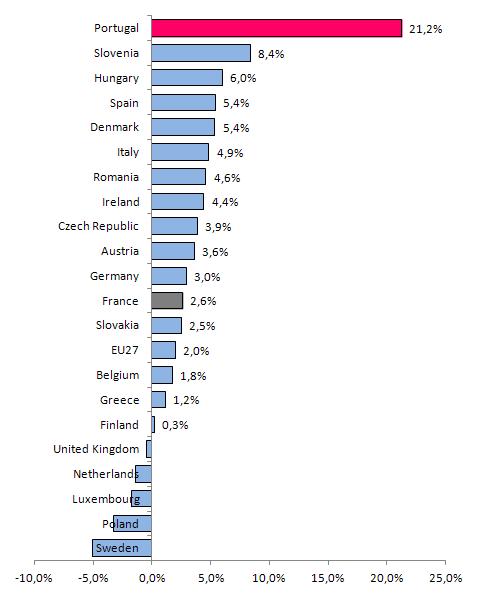
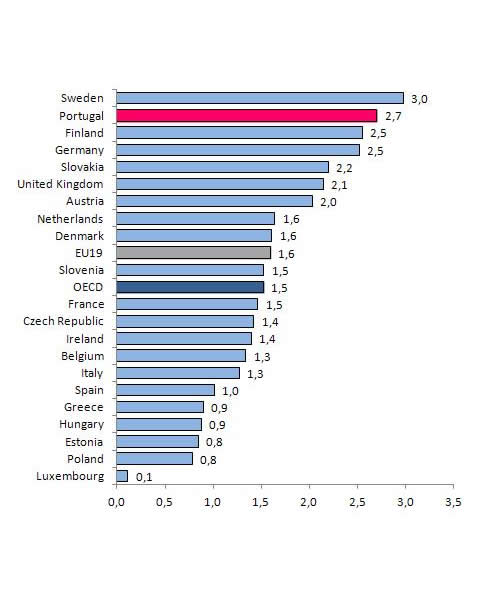
Average annual growth of the percentage of total R&D spending in GDP of Portugal from 2005 to 2009
(%)
Alternative access:
click the image below to amplify
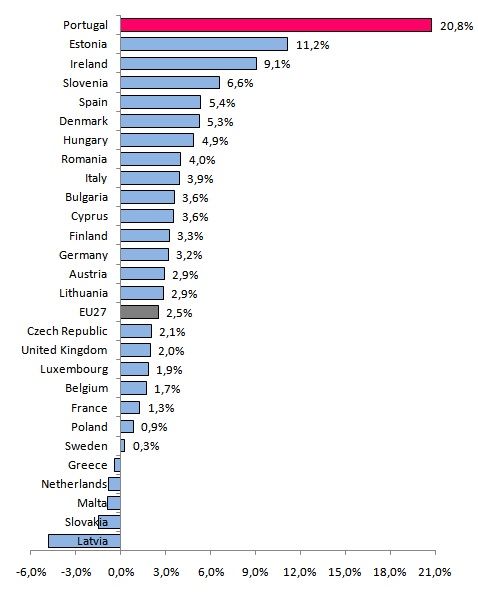
Note: Data used for Greece for 2009 are from 2008, the most recent available.
Source: EUROSTAT, Dec, 2010.
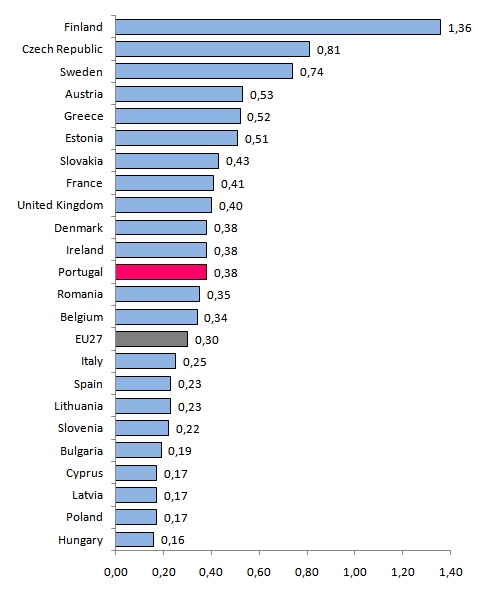
R&D Public Budget as a percentage of GNP in EU Member States
2009, (%)
Alternative access:
click the image below to amplify
Note: Data of Greece for 2009 is from 2007, the last available data.
Source: EUROSTAT, Dec. 2010.
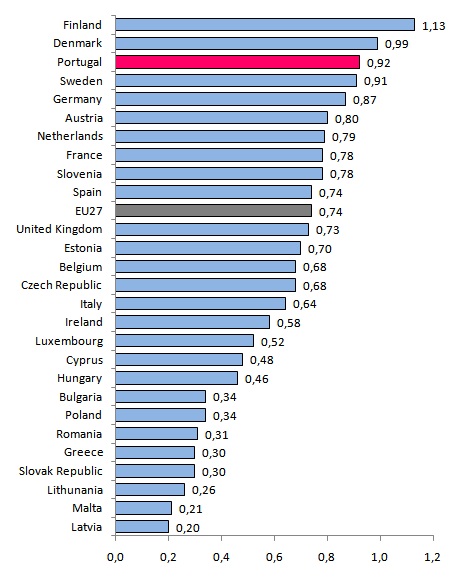
Researchers (FTE) per 1,000 active population
2009, ()
Alternative access:
click the image below to amplify
Note: The value for France in 2009 is that of 2008 and the value for Greece in 2008 and 2009 is that of 2007; in both cases the most recent available.
Source: OECD, Main Science and Technology Indicators, February 2011.
Average annual growth of the number of researchers (FTE) per 1,000 active population in EU Member States, from 2005 to 2009
(%)
Alternative access:
click the image below to amplify
Note: The values for France and Greece in 2009 are those of 2008 and 2007, respectively.
Source: OECD, Main Science and Technology Indicators, February 2011.
Accumulated number of PhDs in Portugal and abroad but recognised by Portuguese Universities since 1970
Total number of PhDs awarded
Alternative access:
click the image below to amplify
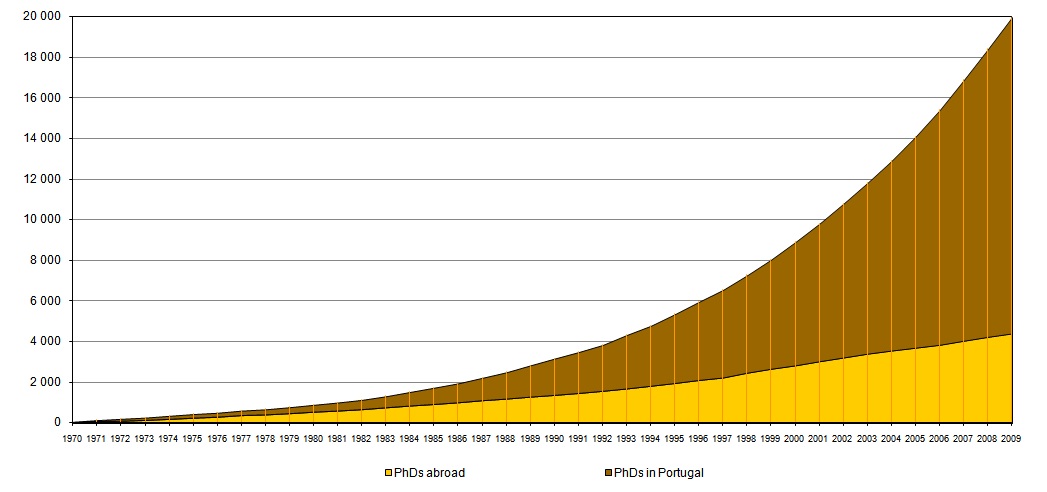
Source: OCT/OCES/GPEARI Statistics, Ministry of Science, Technology and Higher Education.
PhDs from or recognised by Portuguese Universities
Number of Doctorates
Alternative access:
click the image below to amplify
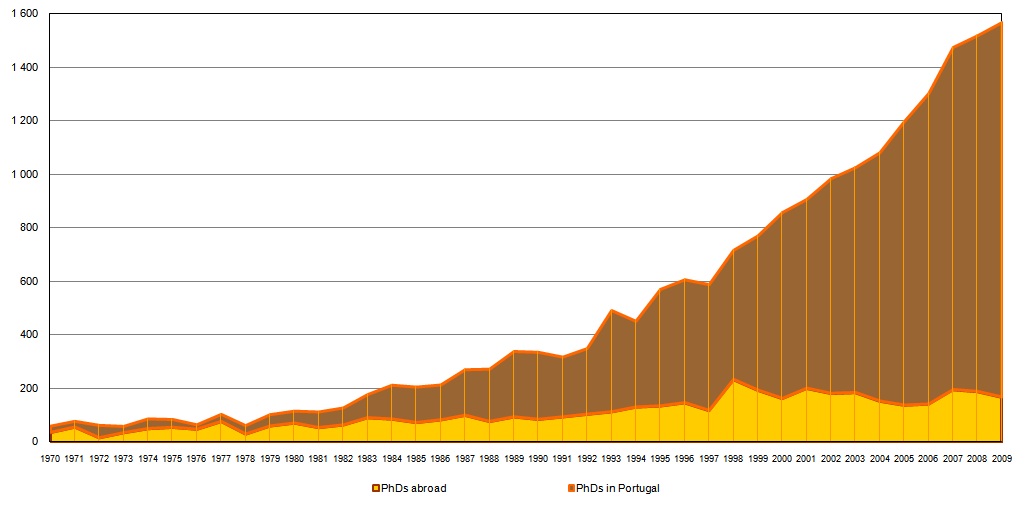
Source: OCT/OCES/GPEARI Statistics, Ministry of Science, Technology and Higher Education.
PhD and Post-Doc fellowships awarded annually by FCT
Number of fellowships awarded
Alternative access:
click the image below to amplify
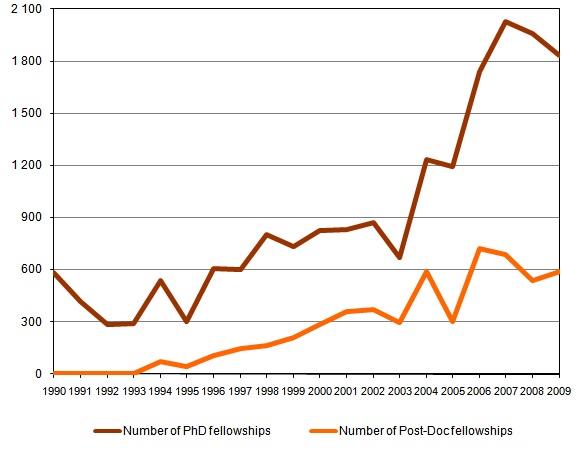
Source: OCT/OCES/GPEARI Statistics, FCT.
PhD Students in S&T* in the 20-29 years old population cohort, in EU Member States
2008, (%)
Alternative access:
click the image below to amplify
Note: No data available for Germany, Netherlands and Luxembourg
Data for Italy and EU27 in 2008 are from 2007, the last available data.
* Sciences, Mathematics, Computer Science, Engineering
Source: EUROSTAT, Jan. 2009.
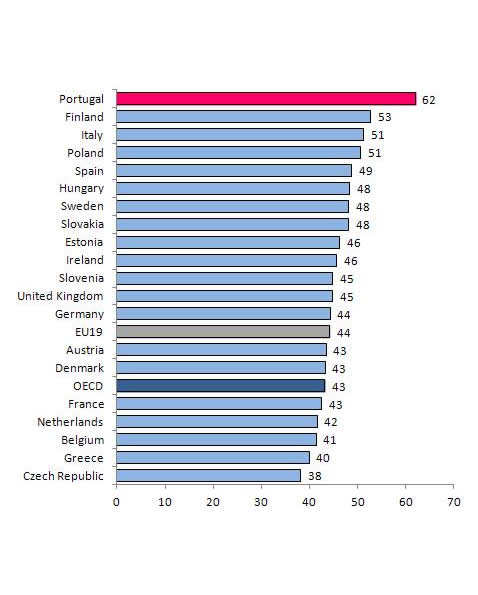
Percentage of PhD's obtained in EU countries in the corresponding age bracket
2009, (%)
Alternative access:
click the image below to amplify
Note: The values for EU19, Greece and Luxembourg in 2009 are those of 2008; the values for Italy in 2008 and 2009 are those of 2007; in both cases the most recent available.
Source: OECD, Science, Technology and Industry Scoreboard 2011.
Percentage of PhD's obtained by women in EU countries
2009, (%)
Alternative access:
click the image below to amplify
Source: OECD, Science, Technology and Industry Scoreboard 2011.
Percentage of PhD's obtained in EU countries in the corresponding age brackets
%
Alternative access:
click the image below to amplify
Note: The values for EU19, Greece and Luxembourg in 2009 are those of 2008; the values for Italy in 2008 and 2009 are those of 2007; in both cases the most recent available..
Source: OECD, Science, Technology and Industry Scoreboard 2011.
Percentage of Population with PhD in Some OECD Member States and Partner Economies
2009, (%) Population 26-64 years old
Alternative access:
click the image below to amplify
Source: Education at a Glance 2011, OECD.
Women Researchers in the Total of Researchers in EU Member States
2009, (%)
Alternative access:
click the image below to amplify
Note: The value for Greece in 2009 is that of 2005, the last one available.
Source: EUROSTAT, Dec. 2011.
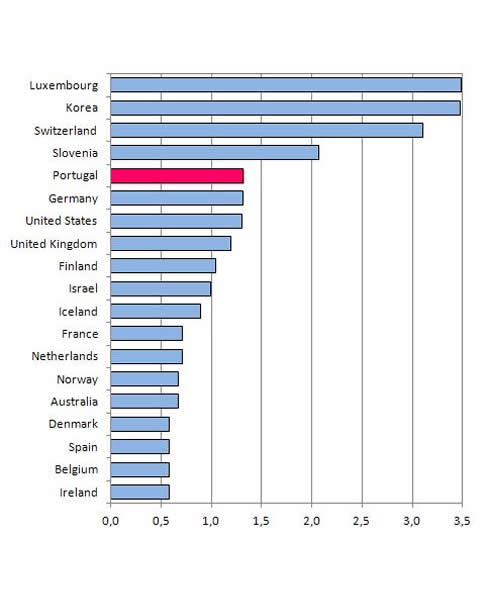
Contribution of the investment in ICT for GDP growth in EU countries and the USA
1990-1995, 1995-20011, (percentage points)
Alternative access:
click the image below to amplify
Note: 1995-2002 for Germany, France and the USA.
Data/Source: OECD.
Expansion of software enterprises with R&D activities
1995-2001, Number of companies
Alternative access:
click the image below to amplify
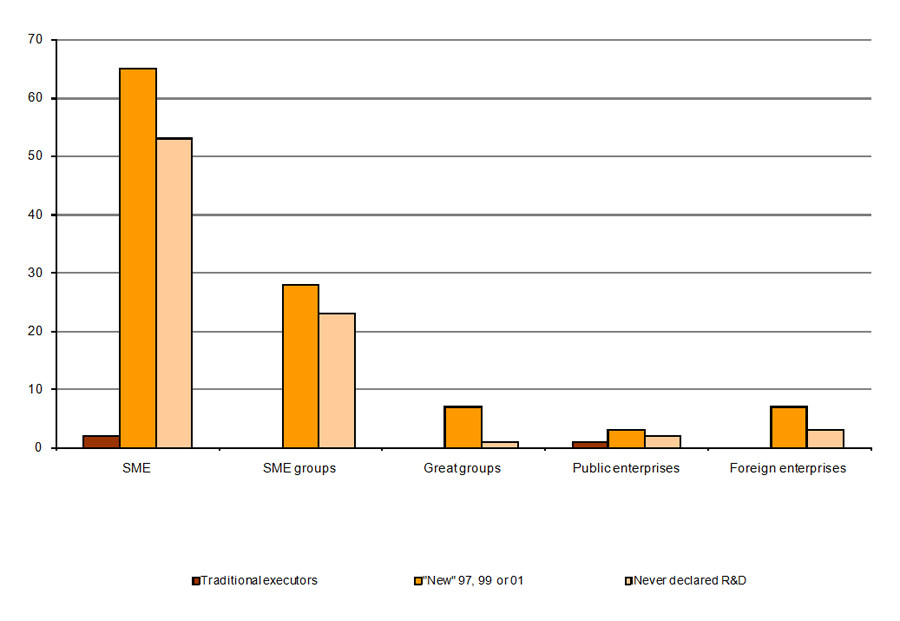
Source: The enlargement of the universe of enterprises with participation in R&D activities (1995-2001),
Part I - Evolution of enterprises R&D activities between 1995 and 2001, Maria Paula Fonseca, OCES, Aug. 2004.